BAAM AI Blog
Web Analytics in Digital Marketing
is the practice of collecting, organizing, analyzing, and acting on website and campaign data so you can understand what people do, where they come from, what helps them convert, and what blocks them from moving...
Web analytics in digital marketing is the practice of collecting, organizing, analyzing, and acting on website and campaign data so you can understand what people do, where they come from, what helps them convert, and what blocks them from moving forward. It is not just “checking traffic.” Done properly, it connects marketing activity to business outcomes.
That distinction matters because digital marketing has become too expensive, too fragmented, and too privacy-sensitive to run on instinct alone. Gartner’s 2025 CMO Spend Survey found that marketing budgets stayed flat at 7.7% of company revenue, while digital channels accounted for 61.1% of total marketing spend in a separate 2025 Gartner release on digital marketing budgets. That means teams are being pushed to prove more with roughly the same resources.
Web analytics gives marketers the operating system for that proof. It shows which channels bring qualified visitors, which pages create intent, which journeys leak revenue, and which actions deserve more budget. Google’s own Analytics positioning focuses on understanding the customer journey and improving marketing ROI, which is exactly where web analytics belongs inside modern digital marketing.
this guide is split into six parts so the topic can build naturally instead of dumping every metric, tool, and tactic into one messy guide. The structure starts with the strategic foundation, then moves into the framework, the core components, the implementation process, and the decisions that analytics should actually improve. Each section name below is the real section name the article will continue using.
Why Web Analytics Matters for Marketing Performance
Marketing teams do not need more dashboards. They need better decisions. Web analytics matters because it turns disconnected activity into a clear picture of what is working, what is wasting money, and what needs to change next.
This is especially important now because the customer journey is no longer simple. A person might discover a brand through search, return through social, compare products on mobile, click an email, watch a video, and convert days later on desktop. Without web analytics, those touchpoints either get ignored or overcredited, and both mistakes can distort budget decisions.
The pressure is also coming from privacy and measurement changes. IAB’s State of Data 2025 frames AI, privacy, campaign activation, and performance measurement as connected parts of the same marketing challenge. In practical terms, that means marketers can no longer treat analytics as a technical afterthought handled after campaigns launch.
Web Analytics in Digital Marketing: The Measurement Foundation
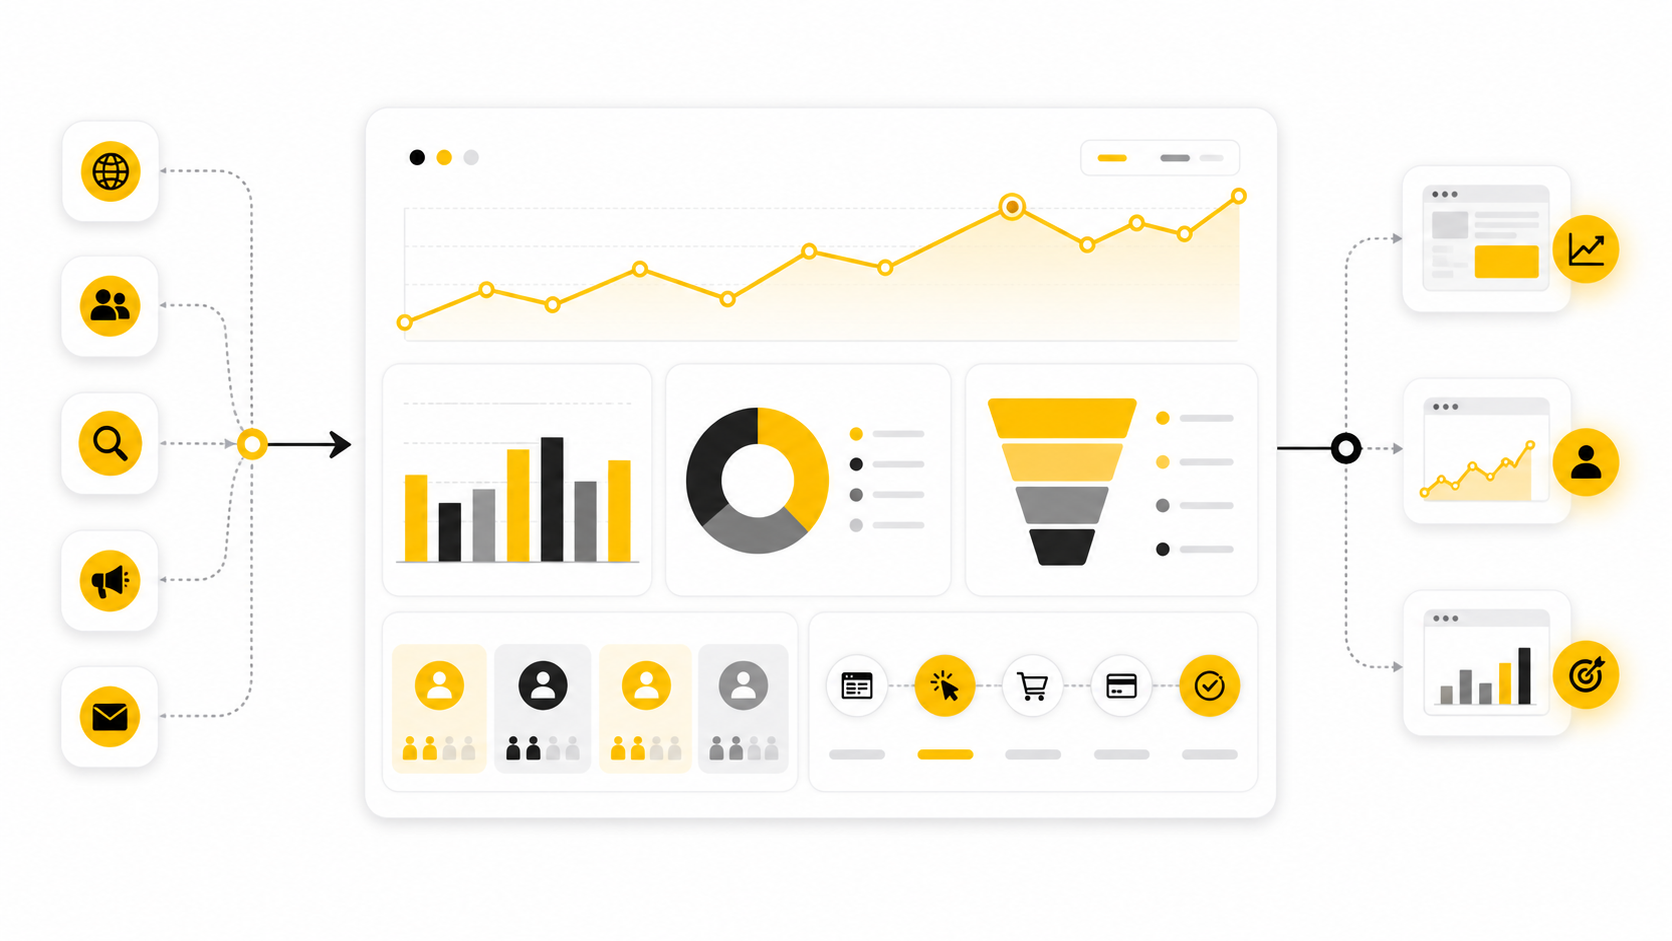
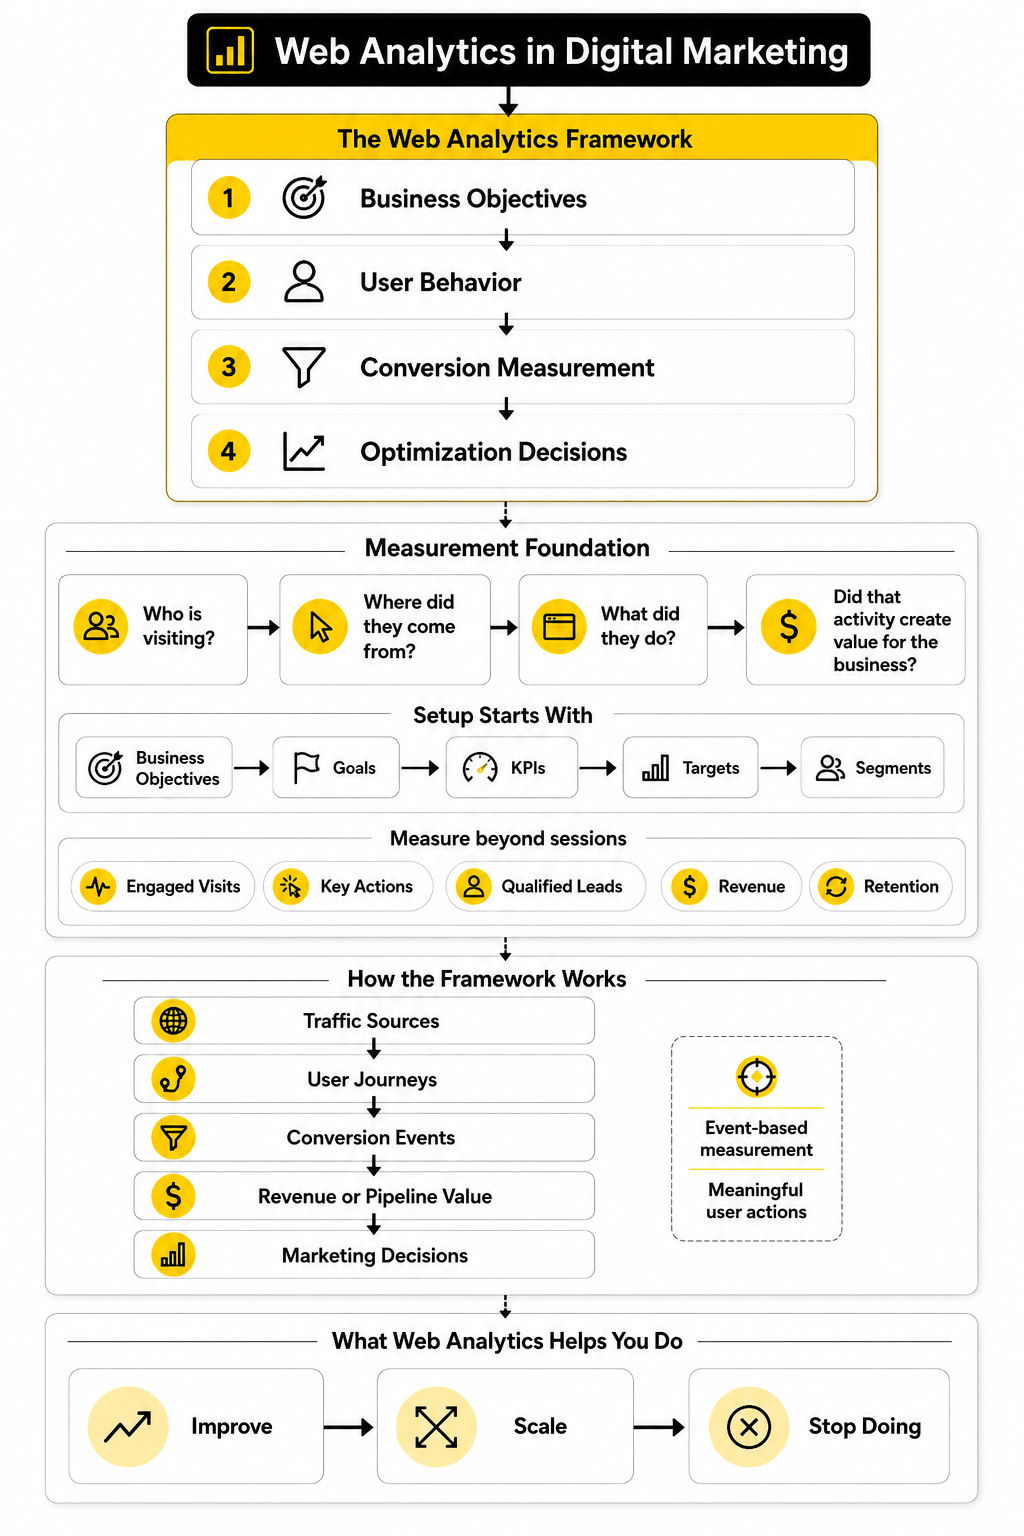
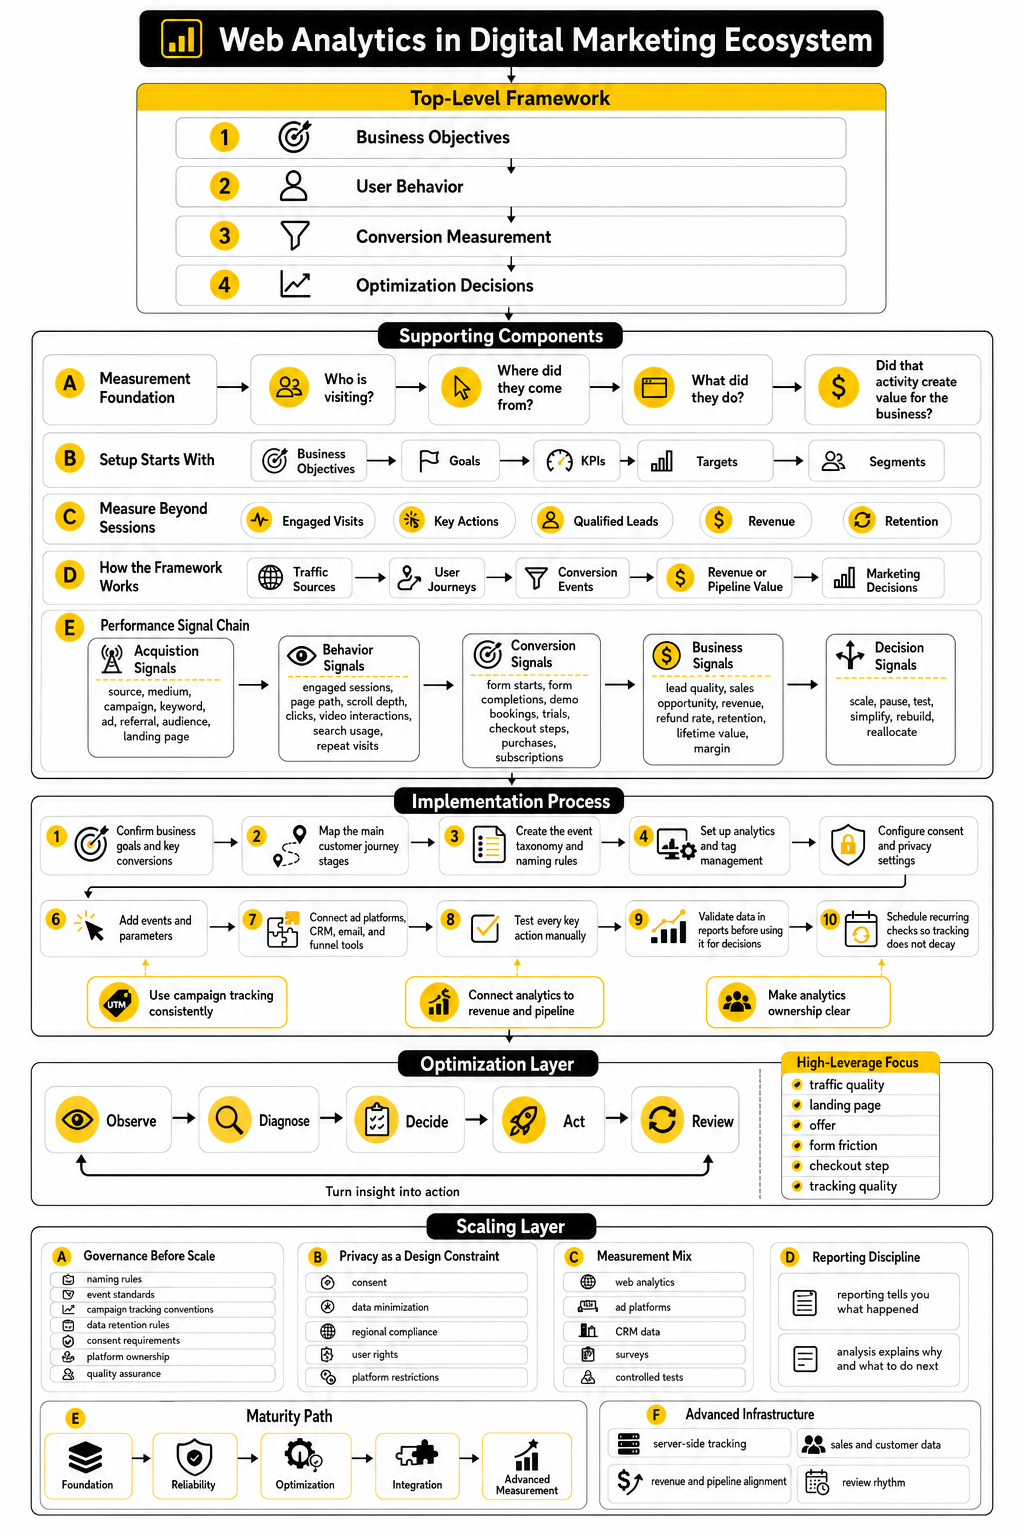
At the foundation, web analytics answers four practical questions. Who is visiting? Where did they come from? What did they do? Did that activity create value for the business? Those questions sound simple, but they force a marketing team to separate noise from useful evidence.
A useful analytics setup starts with business goals, not tool settings. Avinash Kaushik’s long-standing Digital Marketing and Measurement Model makes this point clearly by starting with business objectives, then moving into goals, KPIs, targets, and segments. That order matters because a metric only becomes useful when it is tied to a decision.
For example, “sessions” can tell you whether traffic is rising, but it does not tell you whether the traffic is valuable. A better measurement foundation connects sessions to engaged visits, key actions, qualified leads, revenue, retention, or another business outcome that reflects real progress. This is where web analytics in digital marketing becomes a growth discipline instead of a reporting habit.
The Web Analytics Framework
A strong web analytics framework has four layers: business objectives, user behavior, conversion measurement, and optimization decisions. Each layer depends on the one before it. If the business objective is unclear, the metrics become random; if behavior is not tracked properly, conversion data becomes unreliable; if nobody acts on the insight, the reporting work has no commercial value.
The framework also needs to reflect how modern analytics platforms work. In Google Analytics 4, measurement is built around events, and Google’s documentation explains that recommended events can be configured to measure more useful behaviors across websites and apps. This pushes marketers to think less in terms of pageviews alone and more in terms of meaningful user actions.
The best version of the framework is not complicated. It maps traffic sources to user journeys, user journeys to conversion events, conversion events to revenue or pipeline value, and those outcomes back to marketing decisions. That loop is the point: web analytics should help you decide what to improve, what to scale, and what to stop doing.
Why Web Analytics Matters for Marketing Performance
Most marketing problems do not look like analytics problems at first. They look like weak leads, expensive ads, low conversion rates, poor retention, confusing attribution, or content that gets traffic but does not create revenue. Web analytics in digital marketing matters because it helps you trace those symptoms back to the actual behavior causing them.
This is where a lot of teams get stuck. They check a dashboard, see that traffic is up or down, and stop there. But traffic by itself is not a strategy; it is only the beginning of the question.
The real value comes from connecting marketing inputs to customer actions. If paid search brings visitors who read pricing pages, return through email, and request a demo, that channel deserves a different conversation than a campaign that creates cheap visits with no serious intent. Good analytics makes that difference visible.
It Turns Marketing From Opinion Into Evidence
Every team has opinions. The founder thinks the homepage needs a new headline, the paid media person wants more budget, the content team believes organic search is underfunded, and the sales team says lead quality is the real issue. Without analytics, those conversations become political fast.
Web analytics gives the team a shared source of evidence. It does not remove judgment, and it should not replace strategy, but it gives people something concrete to inspect. You can see where visitors enter, which pages they view, which forms they abandon, which devices convert poorly, and which traffic sources create the highest-value actions.
This matters even more when budgets are tight. Gartner’s 2025 CMO Spend Survey reported that marketing budgets remained flat at 7.7% of overall company revenue, while digital channels represented 61.1% of total marketing spend. When that much spend runs through digital channels, guessing is expensive.
It Shows Where the Customer Journey Breaks
A marketing funnel rarely fails in one clean place. Sometimes the ad promise is strong, but the landing page does not match it. Sometimes the landing page works, but the form asks for too much information. Sometimes the form converts, but the follow-up is slow, irrelevant, or impossible to track.
Web analytics helps you find those breaks by looking at behavior across the full journey. You can compare landing page engagement, scroll depth, click paths, form starts, form completions, checkout steps, and returning visitor behavior. The goal is not to stare at every possible metric; the goal is to identify the moments where intent disappears.
This is why web analytics in digital marketing should not be limited to acquisition reports. Acquisition tells you where people came from, but behavior tells you whether the experience helped them move forward. Conversion data then shows whether that movement created value.
It Protects Budget From Misleading Metrics
Some metrics look impressive and still mislead you. A campaign can produce a high click-through rate while bringing the wrong audience. A blog post can generate thousands of visits while contributing almost nothing to pipeline. A social campaign can create engagement without moving people closer to purchase.
That does not mean those metrics are useless. It means they need context. A click is more meaningful when you know what happened after the click, and a pageview is more useful when you understand whether it influenced a later conversion.
This is one of the most practical reasons analytics matters. It helps protect budget from being pulled toward easy-to-measure activity instead of valuable activity. If a metric cannot help you make a better decision, it should not be treated like a performance goal.
It Helps Teams Improve Conversion Instead of Just Buying More Traffic
Buying more traffic is often the lazy fix. If a funnel converts poorly, adding budget can hide the problem for a while, but it rarely solves it. Web analytics forces a better question: what would happen if the same traffic converted more efficiently?
That question is powerful because conversion improvements compound across channels. Better landing pages help paid search, paid social, organic search, email, referral traffic, and direct visitors. Better forms, clearer calls to action, stronger product pages, and faster pages can improve performance without increasing media spend.
This is also where analytics becomes practical for tool choices. A team using a funnel builder such as ClickFunnels, an all-in-one platform such as GoHighLevel, or a landing page system such as Systeme.io still needs clean measurement behind the scenes. The tool can help publish the funnel, but analytics shows whether the funnel is actually doing its job.
It Supports Better Personalization
Personalization is not just adding someone’s first name to an email. Real personalization depends on understanding behavior, intent, source, lifecycle stage, and previous actions. Web analytics provides part of that foundation by showing what people care about before they convert.
McKinsey’s work on personalized marketing notes that 71% of consumers expect personalized interactions and 76% get frustrated when they do not receive them. That expectation puts pressure on marketers to use data responsibly and intelligently. People do not want random automation; they want relevance.
Analytics helps separate useful personalization from creepy or lazy personalization. If someone repeatedly visits comparison pages, pricing pages, or implementation content, that behavior can shape what they see next. The marketer’s job is to use that signal to reduce friction, not overwhelm the person with aggressive retargeting.
It Makes Privacy-First Marketing More Practical
The privacy shift has changed what marketers can measure and how confidently they can measure it. Browser restrictions, consent requirements, cookie changes, platform limitations, and data quality issues all affect reporting. This does not make analytics less important; it makes disciplined analytics more important.
IAB’s State of Data 2025 frames measurement, privacy, AI, campaign activation, and optimization as connected challenges across the media lifecycle. That is the right way to think about it. Measurement is no longer just a technical setup; it is part of how a company earns trust and still makes smart marketing decisions.
A privacy-first analytics approach focuses on clear consent, first-party data, event quality, server-side support where appropriate, and honest reporting. It also accepts that not every action can be perfectly tracked. The goal is not fantasy-level certainty; the goal is reliable enough evidence to make better decisions.
It Gives Leadership a Clearer View of Marketing’s Impact
Leadership usually does not care about every campaign metric. They care about growth, profitability, pipeline, retention, customer acquisition cost, and return on spend. Web analytics helps translate marketing activity into language the business can act on.
That translation is critical. If marketing only reports impressions, clicks, and traffic, it can look busy without proving impact. If it connects those actions to qualified leads, purchases, demo requests, trials, revenue, or retention signals, the conversation changes.
This is why web analytics in digital marketing should be built with reporting layers for different audiences. Practitioners need diagnostic detail, managers need performance trends, and leadership needs decision-ready business insight. One dashboard cannot serve all three equally well.
It Reveals What To Stop Doing
One of the most underrated benefits of analytics is subtraction. It shows which campaigns, pages, audiences, offers, and channels are consuming effort without producing meaningful progress. That is uncomfortable, but it is valuable.
Marketers often want analytics to reveal hidden winners. Sometimes it does. But just as often, the biggest win comes from cutting low-quality activity and reallocating time or money to what already shows stronger intent.
This is where confident teams separate themselves from busy teams. They do not treat every campaign as sacred. They use analytics to make practical calls: pause this, test that, simplify this journey, rebuild that page, and stop spending money where the data keeps warning you.
The Web Analytics Framework
The framework only works when it turns strategy into measurement. That sounds obvious, but many teams still install analytics first and decide what they want to know later. That order creates messy reports, vague conversions, and arguments about numbers nobody fully trusts.
A better framework starts with the customer journey and then defines the data needed to understand it. In web analytics in digital marketing, you are usually trying to measure how people arrive, what they engage with, where they hesitate, what they complete, and what happens after the conversion. The framework should make those movements visible without turning the setup into a technical monster.
The goal is not to track everything. The goal is to track the right actions with enough consistency that the team can compare performance over time. Once that is in place, analytics becomes a practical decision system instead of a pile of disconnected charts.
Start With Business Objectives
Before you touch tags, pixels, events, dashboards, or reports, define the business outcome. Are you trying to increase qualified leads, product purchases, booked calls, free trial starts, repeat purchases, subscription upgrades, or sales conversations? Each goal needs a different measurement plan.
This step matters because vague objectives create vague analytics. “Improve the website” is not a measurement objective. “Increase demo requests from qualified organic and paid traffic” gives you something useful to build around.
Once the objective is clear, define the actions that signal progress toward it. A visitor who reads a comparison page, views pricing, starts a form, and returns within a week is showing a very different level of intent than someone who lands on a blog post and leaves after ten seconds. Your analytics framework should help you separate those behaviors.
Map the Customer Journey
The next step is to map the real journey people take before converting. This does not need to be fancy. You need a practical view of the main paths from discovery to decision.
For most businesses, the journey includes discovery pages, education pages, product or service pages, proof pages, pricing pages, forms, checkout steps, booking pages, and post-conversion follow-up. Each stage should have a clear purpose. If a page does not help a person understand, trust, compare, decide, or act, the analytics will usually expose that weakness.
This is also where channel context matters. Organic visitors may arrive with research intent, paid visitors may arrive through a specific promise, email visitors may already know the brand, and returning visitors may be closer to action. Treating all sessions the same hides the most useful patterns.
Define Events That Match Real Intent
Events are the backbone of modern web analytics. Pageviews still matter, but they are not enough. You need event data that captures meaningful actions.
Useful events can include form starts, form submissions, checkout progress, outbound clicks, video engagement, pricing page clicks, account signups, lead magnet downloads, demo bookings, chatbot interactions, email opt-ins, and important CTA clicks. The key is to name and organize them consistently so the data remains readable later. Google Analytics 4 is built around an event-based model, and its recommended event documentation is designed to help businesses measure useful behaviors beyond automatic tracking.
Do not create twenty versions of the same action because different team members named it differently. That is how analytics gets ugly fast. A clean event taxonomy should define the event name, trigger, parameters, conversion status, destination platform, and business purpose.
Build the Measurement Plan
The measurement plan is where the framework becomes concrete. It translates objectives, journey stages, and events into a working implementation checklist. This is the document that keeps marketers, developers, analysts, and leadership aligned.
A simple measurement plan should answer these questions:
This is not busywork. It prevents the classic problem where everyone assumes tracking works until a launch ends, the report looks wrong, and nobody knows whether the campaign failed or the analytics broke.
Implement Tracking in the Right Order
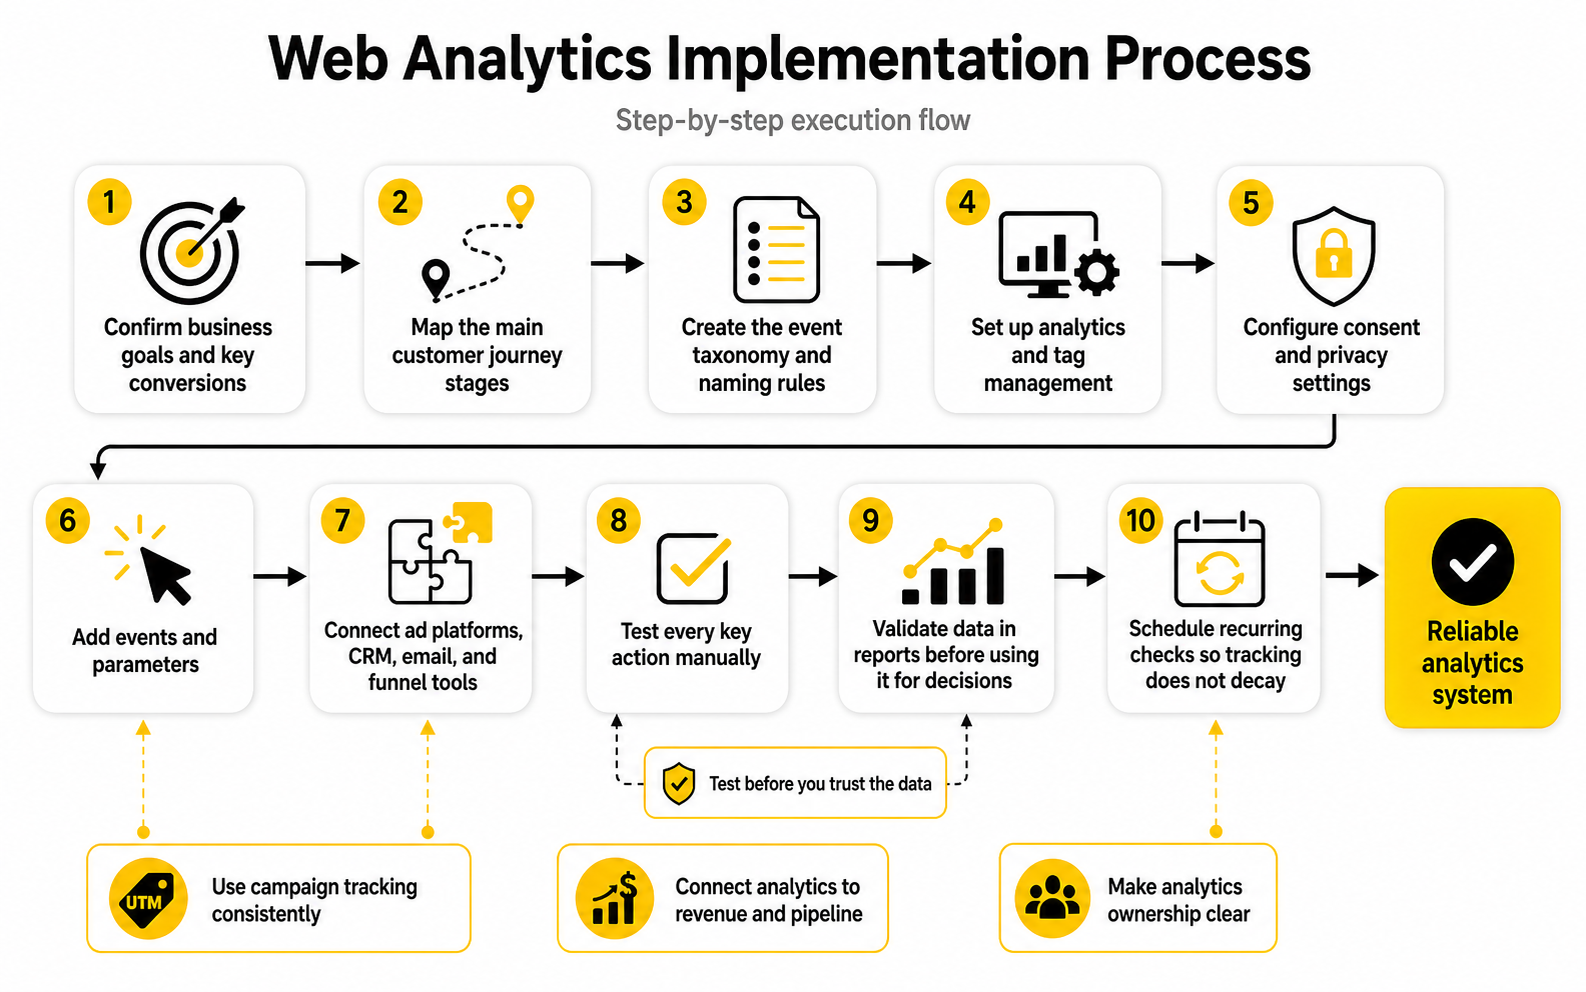
Implementation should follow a sequence. Random tracking creates random data. A structured rollout gives you a cleaner setup and makes troubleshooting much easier.
Start with the analytics platform and tag management foundation. Then configure consent behavior, define core events, connect campaign parameters, test conversion actions, and validate reports before judging performance. If you are working with a funnel tool like ClickFunnels, an agency CRM like GoHighLevel, or an email platform like Brevo, the same principle applies: the tool stack should support the measurement plan, not replace it.
A practical implementation sequence looks like this:
Use Campaign Tracking Consistently
Campaign tracking is one of the simplest parts of analytics, and somehow it is still one of the easiest to ruin. Inconsistent UTMs can split one campaign into five different rows, hide paid performance inside referral traffic, or make reports impossible to compare. That is not a small reporting issue; it can lead to bad budget decisions.
Every team needs clear rules for source, medium, campaign, content, and term. The names should be lowercase, predictable, and shared across the team. If one person uses “paid-social,” another uses “paidsocial,” and another uses “facebook_ads,” your reports will look more complicated than the customer journey actually is.
The fix is simple but requires discipline. Create a campaign naming sheet, make it the standard, and do not launch campaigns without it. This is boring in the best possible way because boring naming conventions create clean data.
Connect Analytics to Revenue and Pipeline
Traffic and engagement data are useful, but they are not enough for serious marketing decisions. Eventually, analytics has to connect to money, pipeline, or customer value. Otherwise, the team can optimize for activity while missing the business outcome.
For ecommerce, that usually means product views, add-to-cart events, checkout steps, purchase events, revenue, refunds, and repeat purchase behavior. For lead generation, it means form submissions, booked calls, qualified leads, sales opportunities, closed deals, and source quality. For SaaS, it often includes trials, activation events, subscription starts, upgrades, churn indicators, and expansion behavior.
This is where the gap between marketing analytics and business analytics starts to close. A campaign that produces fewer leads may still be better if those leads become better customers. A page with lower traffic may still be more valuable if it influences high-intent conversions.
Validate the Data Before You Trust It
Never assume the data is correct just because a dashboard has numbers in it. Analytics platforms can collect duplicate events, miss conversions, misclassify channels, ignore consent settings, break after a site update, or lose context during redirects. Clean implementation still needs validation.
Validation should include test conversions, real-time checks, browser testing, device testing, consent testing, referral exclusion checks, UTM checks, CRM matching, and comparison against backend records. The point is not to make the data perfect. The point is to make it reliable enough for decisions.
This is especially important before reporting campaign results. If the tracking was broken, the campaign may look worse than it was. If events fired twice, the campaign may look better than it was. Both situations are dangerous because they push the team toward the wrong next move.
Make Analytics Ownership Clear
Analytics fails when nobody owns it. The marketer assumes the developer checked it. The developer assumes the marketer defined the event. The manager assumes the analyst will catch the issue. Then three months later, the team realizes the main conversion was not tracked properly.
Ownership does not mean one person does everything. It means every part of the process has a clear owner. Someone owns the measurement plan, someone owns implementation, someone owns quality assurance, someone owns reporting, and someone owns decisions.
This is where professional teams become much calmer. They do not treat analytics as a one-time setup. They treat it as infrastructure that needs documentation, testing, governance, and maintenance. That is the only way web analytics in digital marketing stays useful as campaigns, tools, pages, and privacy requirements keep changing.
Statistics and Data
The numbers matter, but only when they help you make a better decision. A benchmark can show whether performance is unusually weak, unusually strong, or simply normal for the market. But a benchmark should never become the strategy by itself.
This is where web analytics in digital marketing needs context. A 2% conversion rate might be weak for a low-ticket impulse product, solid for a higher-consideration ecommerce store, and completely irrelevant for a B2B service where one qualified lead can be worth thousands. The right question is not “Is this metric good?” The better question is “What does this number mean for this business model, this channel, and this customer journey?”
The best teams use statistics as diagnostic signals. They compare current performance against past performance, channel intent, device type, page role, and commercial value. That is how raw data becomes useful.
Benchmarks Are Starting Points, Not Targets
Benchmarks help you understand the market, but they can also make you lazy if you treat them as final answers. Smart Insights’ 2025 ecommerce benchmark update points marketers toward sector and device comparisons because conversion rates vary heavily by industry, region, and shopping context. That is the right mindset: compare carefully, then investigate the reason behind the gap.
A broad ecommerce conversion rate average can be useful for orientation, but it is not enough to judge your own site. Triple Whale’s 2026 ecommerce benchmark summary places the global average around 1.9% to 2%, while other benchmark sources vary depending on dataset, region, vertical, and platform mix. That spread is the lesson. The number is not universal.
For a marketer, the action is simple. Use external benchmarks to detect whether your performance might be outside a normal range, then use your own analytics to diagnose why. Your internal baseline is usually more useful than someone else’s average.
Conversion Rate Needs Segmentation
Conversion rate is one of the most misunderstood metrics in analytics. It looks clean because it reduces performance to one percentage, but that simplicity hides major differences. A single sitewide conversion rate can blend together branded search, cold paid social, returning email visitors, mobile traffic, desktop traffic, blog readers, pricing page visitors, and checkout abandoners.
That blended number is too blunt for decision-making. If organic search converts at 0.8%, paid search converts at 4%, and email converts at 7%, the sitewide average does not explain what to do next. You need segmentation by channel, campaign, device, landing page, intent stage, and audience type.
This is why web analytics in digital marketing should treat conversion rate as a diagnostic metric, not a trophy. If conversion falls, do not panic until you know where it fell. If conversion rises, do not celebrate until you know whether the increase came from better quality traffic, easier conversion paths, discounting, tracking changes, or a real improvement in persuasion.
Traffic Quality Matters More Than Traffic Volume
Traffic growth feels good, but it can hide poor performance. If visits rise and conversions stay flat, the site may be attracting the wrong audience. If traffic drops but revenue holds steady, the team may have cut low-quality visits without harming the business.
Contentsquare’s 2025 Digital Experience Benchmarks release reported that brands were paying more to acquire online customers while user frustration contributed to a 6.1% drop in conversions. That is the exact kind of statistic marketers should pay attention to because it connects acquisition cost, user experience, and conversion performance. More traffic does not fix a frustrating journey.
The action is to measure traffic quality by behavior, not just volume. Look at engaged sessions, repeat visits, key page views, depth of interaction, form starts, cart additions, lead quality, revenue per session, and post-conversion quality. Good traffic moves; bad traffic bounces around or disappears.
Engagement Metrics Need a Job
Engagement metrics can be useful, but only when you define what they are supposed to tell you. Time on page, scroll depth, engaged sessions, video plays, and click behavior should help explain whether a visitor is consuming, comparing, hesitating, or preparing to act. Without that interpretation, engagement becomes decoration.
For content pages, engagement can show whether the page actually answers the visitor’s question. For product pages, it can show whether people inspect key details before clicking forward. For landing pages, it can reveal whether visitors interact with the call to action or stall before the form.
The important move is to connect engagement to the next step. A long session is not automatically good. It might mean deep interest, or it might mean confusion. Pair engagement metrics with conversion paths, exit behavior, and qualitative research before deciding what to change.
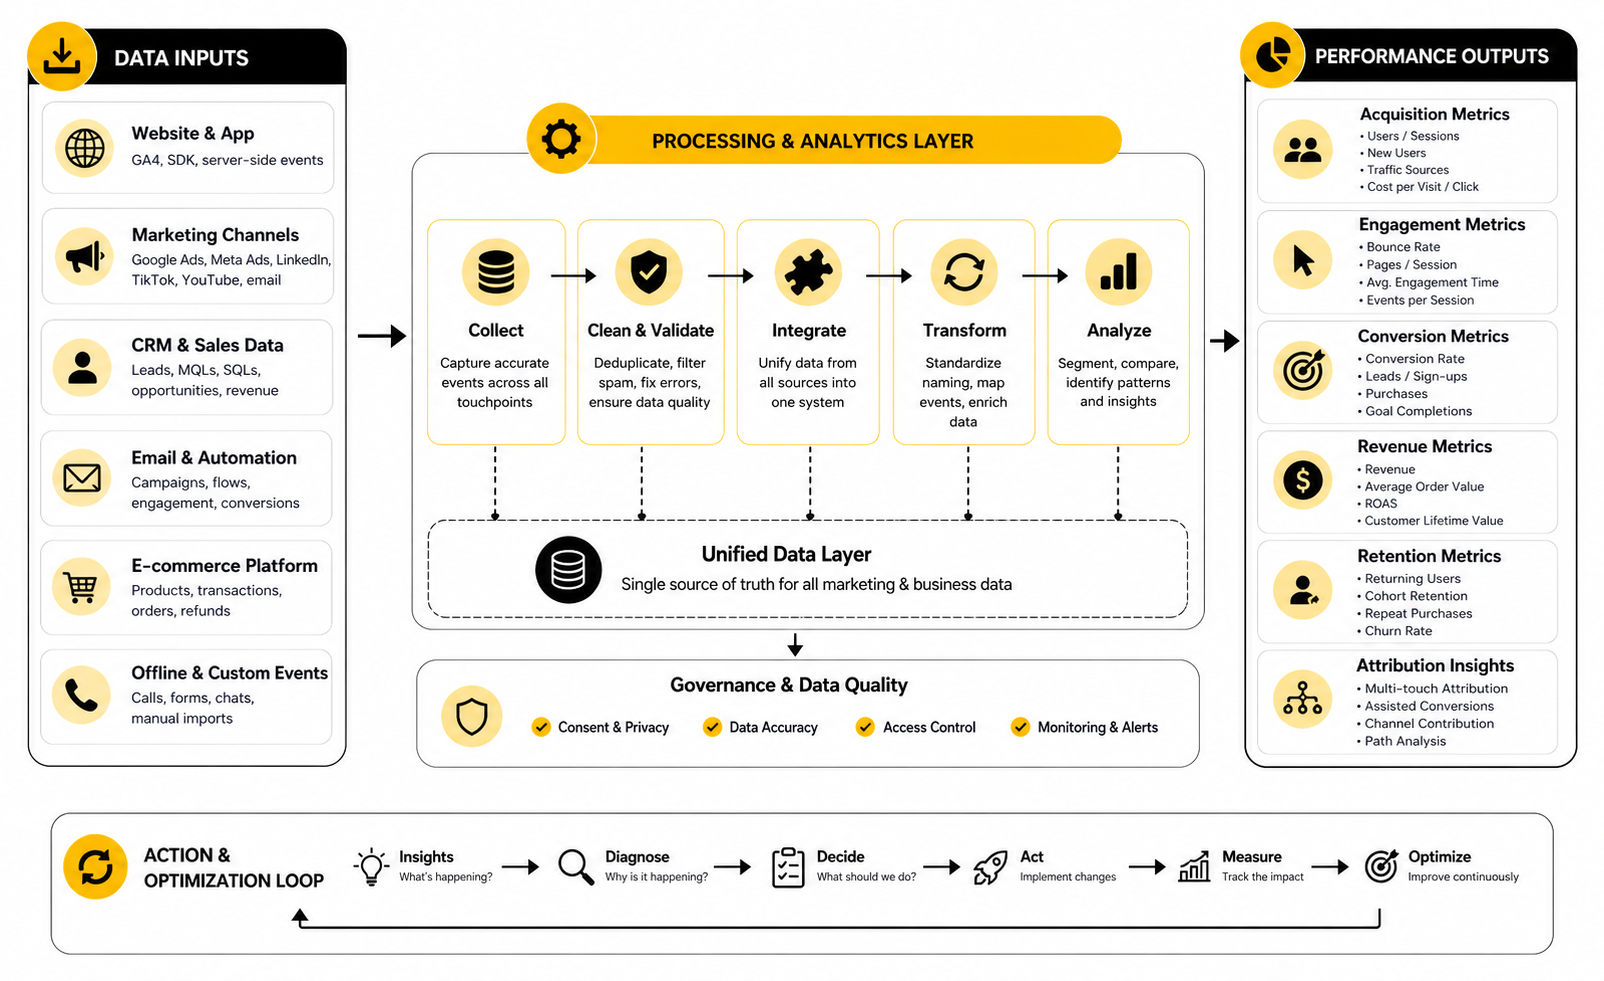
The Analytics System Should Connect Signals
A strong analytics system does not treat metrics as isolated boxes. It connects acquisition signals, behavior signals, conversion signals, and business signals into one chain. That chain is what lets a marketer see where performance is created or lost.
The basic signal chain looks like this:
This is the practical heart of web analytics in digital marketing. The system should not just show what happened. It should help you understand what deserves action.
Data Quality Is a Performance Issue
Bad data is not a reporting inconvenience. It directly affects budget, targeting, forecasting, sales handoffs, and leadership trust. If campaign names are inconsistent, conversions fire twice, lead sources are overwritten, or CRM fields are incomplete, the team can easily optimize toward the wrong thing.
Marketing data quality has become a serious operational issue. Integrate’s 2025 State of Marketing Data report says 73% of marketers admit their lead data is inaccurate or outdated, while Adverity’s 2025 research highlights data quality as a top lever marketers want to pull for performance improvement. Those findings point to the same truth: analytics only helps when the underlying data is trustworthy enough to use.
The action is not glamorous, but it matters. Standardize naming, document events, audit conversions, clean CRM fields, test forms, monitor duplicates, and reconcile analytics data with backend records. Clean data is not exciting until it saves you from a very expensive mistake.
Attribution Should Guide Decisions, Not Create Fights
Attribution is useful when it helps a team understand contribution. It becomes toxic when people use it to defend their channel at all costs. The customer journey is too mixed for one simple model to explain everything perfectly.
Last-click attribution can undervalue early discovery channels. First-click attribution can overvalue awareness and ignore what actually closed the conversion. Data-driven models can be useful, but they still depend on data quality, consent, platform visibility, and event setup.
The healthiest approach is to use attribution as one input, not the final truth. Compare models, look for directional patterns, and combine analytics with CRM data, customer interviews, and sales feedback. The goal is not to win an attribution argument; the goal is to make better allocation decisions.
Performance Signals Should Trigger Specific Actions
Metrics should have consequences. If a number changes and nobody knows what to do with it, that number is not ready for reporting. Every important metric should connect to a possible action.
A practical action map might look like this:
This is where analytics becomes management. You are not collecting data to admire it. You are collecting data so the next move is clearer.
Dashboards Should Be Built Around Decisions
A dashboard is only useful if it helps someone act. Too many dashboards are built around what the platform can display instead of what the business needs to decide. That creates visual noise.
A good dashboard has a clear audience. Practitioners need granular campaign and behavior data. Managers need trend lines, channel comparisons, and conversion diagnostics. Leadership needs business impact, risk, and priority decisions.
Do not try to make one dashboard do everything. Build separate reporting views for daily troubleshooting, weekly performance review, and monthly strategic decisions. Web analytics in digital marketing becomes much easier to use when each report has a job and every chart earns its place.
Professional Implementation and Optimization
At a certain point, web analytics stops being a setup task and becomes an operating discipline. The basics get you visibility. Professional implementation gives you consistency, trust, and the ability to scale decisions across campaigns, teams, and tools.
This is where many businesses underestimate the work. They install analytics, connect a few platforms, and assume they now have a measurement system. But a real system needs governance, documentation, validation, privacy controls, ownership, and a clear connection between marketing performance and business outcomes.
Web analytics in digital marketing becomes more valuable as complexity increases. More channels, more landing pages, more campaigns, more automation, and more customer touchpoints all create more room for bad data. The solution is not more dashboards. The solution is a more disciplined analytics operation.
Build Governance Before Scale
Scaling without governance creates reporting chaos. One campaign uses clean UTMs, another uses random naming, one page fires a conversion on button click, another fires it on thank-you page load, and the CRM overwrites the original source halfway through the journey. The team may still have reports, but the numbers are not comparable.
Governance keeps the system usable. It defines naming rules, event standards, campaign tracking conventions, data retention rules, consent requirements, platform ownership, and quality assurance steps. None of this sounds exciting, but it is what separates a professional analytics setup from a fragile one.
The point is not to slow marketers down. The point is to make sure every campaign adds clean signal instead of more noise. If people can move quickly while following shared standards, analytics becomes easier to trust.
Treat Privacy as a Design Constraint
Privacy cannot be bolted on after the tracking is built. Consent, data minimization, regional compliance, user rights, and platform restrictions now shape what can be collected and how it can be used. That means privacy belongs inside the analytics design process from the start.
IAB’s 2025 State of Data companion guide frames modern marketing measurement around AI-powered, data-driven, and privacy-first strategies for planning, activation, analytics, and optimization. That framing is useful because it avoids the false choice between performance and responsibility. You need both.
A practical privacy-first setup asks better questions. Do we need this data? Do users understand what is being collected? Is consent respected across platforms? Are sensitive fields excluded from analytics tools? Are conversions still measurable when identifiers are limited? These questions protect the business and improve the quality of the measurement system.
Plan for Missing and Imperfect Data
Perfect attribution is gone, and honestly, it was never as perfect as people pretended. Cookie restrictions, consent choices, walled gardens, cross-device journeys, offline sales, CRM delays, and platform modeling all create blind spots. Professional marketers accept this instead of trying to force false precision.
That does not mean giving up. It means using a measurement mix. Web analytics can show on-site behavior, ad platforms can show media delivery, CRM data can show lead and revenue quality, surveys can add customer context, and controlled tests can reveal lift that attribution models miss.
The strategic tradeoff is simple. If you chase perfect certainty, you will move too slowly. If you ignore uncertainty, you will make reckless decisions. The more carefully path is to use multiple signals, look for patterns, and make decisions with clear confidence levels.
Use AI Carefully Inside Analytics Workflows
AI is becoming part of analytics, but it should not become a shortcut for thinking. It can help summarize reports, detect anomalies, group behavior patterns, generate hypotheses, and speed up analysis. But it can also make weak assumptions look polished.
IAB’s 2025 State of Data report highlights AI’s growing role across segmentation, media buying, real-time optimization, and performance measurement. Gartner’s 2025 data and analytics trends also point to organizational and human challenges as data work becomes more complex and AI-assisted. That is the real issue: the technology is powerful, but the operating model still matters.
Use AI where it helps you move faster, not where it removes accountability. A model can suggest why conversion dropped, but a marketer still needs to inspect the source data, check tracking changes, review campaign context, and decide what action makes sense. AI should support judgment, not replace it.
Separate Reporting From Analysis
Reporting tells you what happened. Analysis explains why it may have happened and what to do next. Mixing those two jobs creates bloated dashboards and shallow recommendations.
A weekly report should be simple enough to scan. It should show the important movements, the business impact, and the areas that need attention. The deeper analysis can then investigate the cause behind a specific movement, such as a landing page decline, channel quality shift, form abandonment issue, or revenue gap.
This separation matters because teams often confuse visibility with insight. Seeing a metric is not the same as understanding it. Professional analytics creates a rhythm where reports surface the signal and analysis turns that signal into decisions.
Design for Different Levels of Maturity
Not every business needs an enterprise analytics stack. A small service business might only need clean GA4 events, consistent campaign tracking, form tracking, call tracking, and CRM source fields. A larger ecommerce or SaaS company may need data warehousing, server-side tagging, modeled attribution, experimentation, product analytics, and revenue intelligence.
The mistake is copying someone else’s stack without matching your own maturity. Too little infrastructure creates blind spots. Too much infrastructure creates cost, complexity, and unused data.
A practical maturity path looks like this:
The right stage is the one your team can actually operate. Sophisticated tools do not help if nobody maintains them.
Know When To Use Server-Side Tracking
Server-side tracking can improve control, data quality, page performance, and resilience in a privacy-constrained environment. It can also introduce new complexity. That tradeoff needs to be understood before implementation.
For teams spending heavily on paid media or managing complex conversion paths, server-side tracking may be worth exploring. It can help send cleaner event data to platforms, reduce dependency on browser-based tracking, and support more consistent conversion measurement. But it still needs consent logic, documentation, QA, and careful configuration.
Do not treat server-side tracking as a magic fix. It will not repair a weak measurement plan, inconsistent events, or poor CRM hygiene. It is an infrastructure upgrade, not a strategy by itself.
Align Marketing Analytics With Sales and Customer Data
Marketing analytics becomes much stronger when it connects to what happens after the form, purchase, or signup. A lead is not automatically valuable because it converted. A customer is not automatically profitable because they purchased once.
Sales acceptance, opportunity creation, close rate, average order value, refund rate, repeat purchase rate, activation, retention, and lifetime value can all change the interpretation of marketing performance. A campaign with cheaper leads may be worse if those leads rarely qualify. A campaign with higher acquisition cost may be better if it produces customers who stay longer.
This is where tools such as GoHighLevel, Copper, or Brevo can support the workflow when they are configured cleanly. The important part is not the logo on the tool. The important part is whether customer, campaign, and revenue data can be connected well enough to guide decisions.
Avoid Over-Optimization
Analytics can make teams sharper, but it can also make them narrow. If you optimize only for the easiest conversion, you may damage lead quality. If you optimize only for last-click revenue, you may underfund demand creation. If you optimize only for short-term return, you may weaken brand, retention, and long-term growth.
This is one of the biggest expert-level risks in web analytics in digital marketing. The numbers can be technically correct and strategically incomplete. A dashboard can show a winning campaign while the broader business loses positioning, margin, or future demand.
The fix is to define guardrails. Track quality, margin, retention, customer feedback, sales friction, and long-term contribution alongside immediate conversion metrics. Good analytics should help you grow better, not just faster.
Create a Review Rhythm
Analytics only improves performance when the team reviews it consistently. A one-off dashboard build will not change much. A weekly, monthly, and quarterly rhythm will.
Weekly reviews should focus on campaign movement, conversion issues, tracking problems, and obvious optimization opportunities. Monthly reviews should compare channel performance, funnel health, content contribution, customer quality, and budget allocation. Quarterly reviews should look at strategy, measurement gaps, tooling, privacy changes, and bigger growth bets.
The rhythm matters because marketing changes constantly. Campaigns launch, pages change, platforms update, tags break, privacy rules evolve, and customer behavior shifts. A professional analytics process keeps the team close enough to the data to act before small issues become expensive problems.
Turning Web Analytics Into Better Marketing Decisions
At this stage, the point is not to collect more data. The point is to turn the data you already collect into better decisions, faster corrections, and more carefully growth. Web analytics in digital marketing only becomes valuable when it changes what the team does next.
This is the final shift from reporting to operating. A report can tell you that conversion dropped. A decision system tells you whether to inspect traffic quality, fix a landing page, change an offer, rebuild a form, adjust spend, or question the tracking itself.
That is the mindset that makes analytics useful long term. You are not trying to become a dashboard expert. You are trying to build a marketing system that learns.
Build a Decision Loop
A decision loop connects insight to action. Without that loop, even accurate analytics becomes passive. People review the dashboard, nod at the trend, and continue doing the same thing next week.
A practical decision loop has five parts:
This loop is simple, but it requires discipline. The best teams do not treat analytics as a monthly presentation. They use it as a feedback system for marketing decisions.
Prioritize the Highest-Leverage Problems
Not every analytics insight deserves action. Some changes are noise, some are too small to matter, and some are interesting but not commercially useful. Prioritization protects the team from wasting time on low-impact fixes.
High-leverage problems usually sit close to money, intent, or scale. A broken checkout step, a weak demo page, a poor mobile form experience, or a paid campaign sending traffic to the wrong promise deserves attention quickly. A small fluctuation on a low-traffic page usually does not.
Use impact, confidence, and effort to rank what to fix first. If the problem affects a high-volume journey, clearly blocks conversion, and can be tested quickly, it should move to the top of the list. If it is vague, low-volume, and disconnected from business outcomes, park it.
Balance Short-Term Optimization With Long-Term Growth
Analytics is excellent at showing what converts now. That is useful, but it can also pull teams toward overly short-term thinking. The channels and messages that produce immediate conversions are not always the same ones that create future demand.
This matters because customer journeys are increasingly fragmented. IAB’s State of Data 2025 highlights how AI, privacy, activation, and performance measurement are becoming connected parts of the campaign lifecycle. In plain English, marketers need systems that can handle more complexity without pretending every touchpoint can be perfectly reduced to one click.
A mature approach keeps both views in play. Track immediate conversion performance, but also watch qualified traffic, returning visitors, branded search movement, content-assisted journeys, email growth, direct demand, and customer quality. The best analytics setup helps you protect today’s revenue while building tomorrow’s pipeline.
Make the Stack Work as an Ecosystem
Your analytics stack should feel connected. Website analytics, ad platforms, CRM, email tools, funnel builders, forms, calendars, chatbots, and reporting tools all need to support the same measurement logic. If each tool creates its own version of the customer journey, the team will spend too much time reconciling numbers and not enough time improving performance.
This is where tool choices should follow the operating model. A funnel-heavy team may use ClickFunnels, a service business may centralize follow-up inside GoHighLevel, and a team focused on email and CRM workflows may use Brevo. The real question is whether the stack captures the right events, preserves source context, and connects activity to outcomes.
Google’s updated GA4 developer reference explains that recommended events help businesses measure more useful behaviors and generate more useful reports from websites and apps. That same principle applies across the full stack. Tools should not just automate marketing. They should make the journey measurable.
Keep the System Simple Enough To Maintain
Complex analytics systems fail when nobody can maintain them. Too many custom events, too many dashboards, too many naming conventions, and too many unowned integrations create fragility. The system may look advanced, but it becomes risky.
A maintainable analytics system has fewer moving parts, clearer documentation, and stronger ownership. It tracks the events that matter, keeps campaign naming clean, validates key conversions, and makes reporting understandable to the people who use it. That is more valuable than an impressive setup nobody trusts.
The goal is not minimalism for its own sake. The goal is operational clarity. If the team can understand the system, test it, improve it, and explain it, web analytics in digital marketing becomes a real advantage.
What is web analytics in digital marketing?
Web analytics in digital marketing is the process of collecting and analyzing website and campaign data to understand how people find, use, and convert on digital properties. It connects traffic sources, user behavior, conversion actions, and business outcomes. The goal is to help marketers make better decisions instead of relying on assumptions.
Why is web analytics important for marketers?
Web analytics matters because it shows which marketing activities actually create value. It helps teams understand traffic quality, customer journeys, conversion friction, and campaign performance. Without it, marketers can easily spend money on channels that look active but do not produce meaningful business results.
What are the most important web analytics metrics?
The most important metrics depend on the business model, but common ones include traffic source, engaged sessions, conversion rate, key events, revenue, form submissions, lead quality, customer acquisition cost, and lifetime value. The mistake is treating every metric as equally important. The best metrics are the ones connected to decisions.
How is web analytics different from digital analytics?
Web analytics focuses mainly on website behavior, traffic, and conversions. Digital analytics is broader and can include apps, email, ads, CRM data, customer journeys, product usage, offline conversions, and lifecycle performance. In practice, web analytics is often one core layer inside the wider digital analytics system.
What tools are used for web analytics?
Common tools include Google Analytics 4, tag managers, CRM platforms, ad dashboards, heatmap tools, form analytics, call tracking, ecommerce analytics, and data visualization platforms. The right tool depends on the journey you need to measure. A smaller business may need a simple setup, while a larger team may need deeper integrations and warehouse-level reporting.
What is a key event in analytics?
A key event is an important user action that signals progress toward a business goal. Examples include purchases, demo requests, booked calls, signups, lead form submissions, checkout steps, and trial starts. Google’s GA4 event documentation explains how recommended events can be used to measure important behaviors and support better reporting.
How often should web analytics be reviewed?
Campaign and conversion data should usually be reviewed weekly, while deeper channel, funnel, and business performance should be reviewed monthly. Strategic measurement, tooling, and tracking quality should be reviewed quarterly. The review rhythm matters because analytics only helps when the team uses it consistently.
What is the biggest mistake in web analytics?
The biggest mistake is tracking activity without connecting it to decisions. Many teams collect sessions, clicks, impressions, and conversions but never define what those metrics should trigger. If a number changes and nobody knows what action it should drive, the measurement system is incomplete.
How do you know if analytics data is reliable?
Reliable analytics data should match the expected user journey, pass manual testing, align reasonably with backend records, and remain consistent across important reporting views. It should also use clean campaign naming, documented events, and clear ownership. Perfect data is rare, but decision-quality data is achievable.
What is attribution in web analytics?
Attribution is the process of assigning credit to the marketing touchpoints that contributed to a conversion. It helps marketers understand how channels support discovery, consideration, and action. Attribution should guide budget conversations, but it should not be treated as absolute truth because modern journeys are fragmented and measurement gaps are normal.
How does privacy affect web analytics?
Privacy affects what data can be collected, how consent must be handled, and how confidently marketers can identify users across sessions and platforms. A privacy-first analytics setup respects user choices, avoids unnecessary data collection, and still measures meaningful business outcomes. This is now a core part of professional analytics, not a legal afterthought.
Can small businesses benefit from web analytics?
Yes, and they often benefit quickly because small improvements can make a visible difference. A small business does not need an enterprise stack to start. Clean conversion tracking, consistent campaign links, form tracking, and basic source reporting can already reveal which marketing efforts deserve more attention.
How does web analytics improve conversion rates?
Web analytics improves conversion rates by showing where people hesitate, abandon, or fail to take the next step. It can reveal weak landing pages, confusing forms, poor mobile experiences, low-quality traffic, or checkout friction. Once the issue is visible, the team can test a targeted fix instead of guessing.
What should a beginner set up first?
A beginner should start with analytics installed correctly, key conversions defined, campaign tracking rules, consent settings, and a simple dashboard for traffic, engagement, and conversions. After that, they can add event tracking for important actions such as form starts, CTA clicks, bookings, purchases, and email signups. The first goal is clarity, not complexity.
Is web analytics still useful with cookie restrictions?
Yes, but it needs to be handled more carefully. Cookie restrictions and consent choices reduce some visibility, but web analytics still provides valuable patterns about traffic, behavior, conversions, and content performance. The more carefully approach is to combine web analytics with first-party data, CRM records, campaign testing, and clear reporting assumptions.
Build a stronger local presence with BAAM AI
Turn your website, Google profile, social channels, and AI visibility into one growth engine
Most businesses do not need more random marketing activity. They need a consistent presence system that helps the right people find them, trust them, and take action. BAAM AI brings strategy, local SEO, website updates, Google Maps visibility, social content, AI-search readiness, media production, and reporting into one practical monthly engine.
If you want your marketing to keep working after the campaign ends, start with a free BAAM AI presence audit. See how your business shows up today and where the fastest visibility wins are at BAAM AI.