BAAM AI Blog
Statistics And Data That Actually Matter
The numbers in self hosted email marketing only help when they change what you do next. Random benchmarks are easy to collect and easy to misunderstand. A 40% open rate can still hide weak revenue, poor segmentation...
The numbers in self hosted email marketing only help when they change what you do next. Random benchmarks are easy to collect and easy to misunderstand. A 40% open rate can still hide weak revenue, poor segmentation, or inflated tracking from privacy tools, while a lower open rate can still be healthy if the campaign reaches the right people and drives the right action.
Measurement should answer practical questions. Did the email get accepted by receiving servers? Did it reach the inbox? Did the right people engage? Did complaints stay low? Did the campaign create revenue, replies, bookings, product usage, or another business outcome that matters?
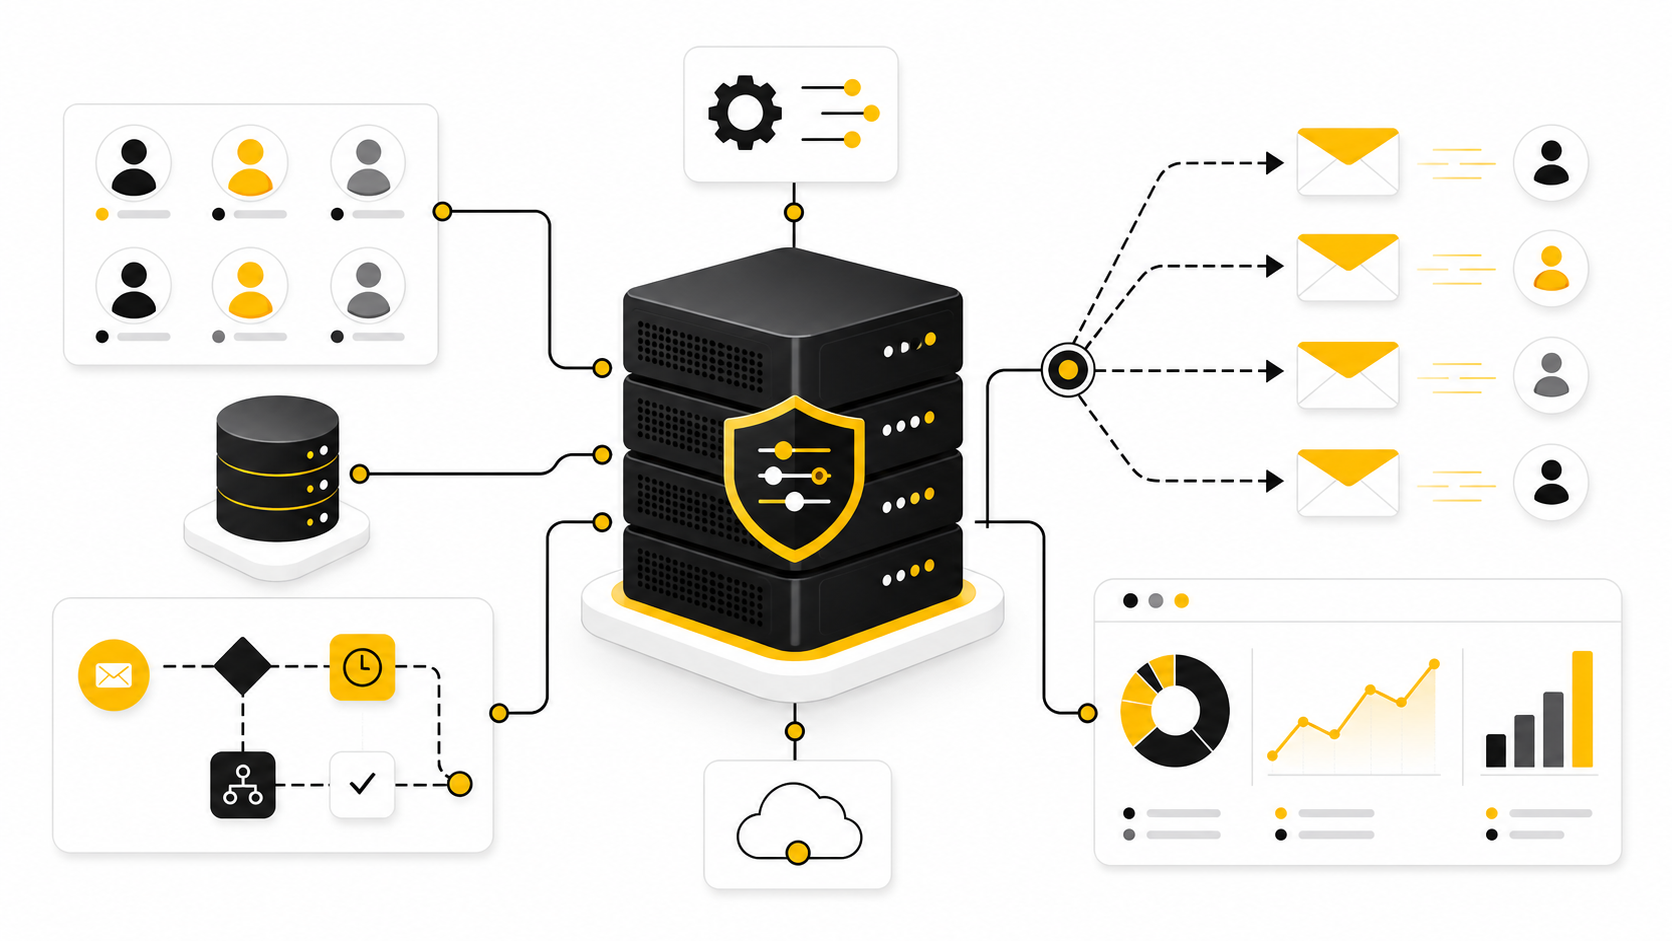
This is why self hosted setups need a tighter analytics habit than most SaaS users. You are not only checking whether a campaign “performed.” You are watching the health of the whole system: list quality, sender reputation, content relevance, subscriber trust, and conversion path.
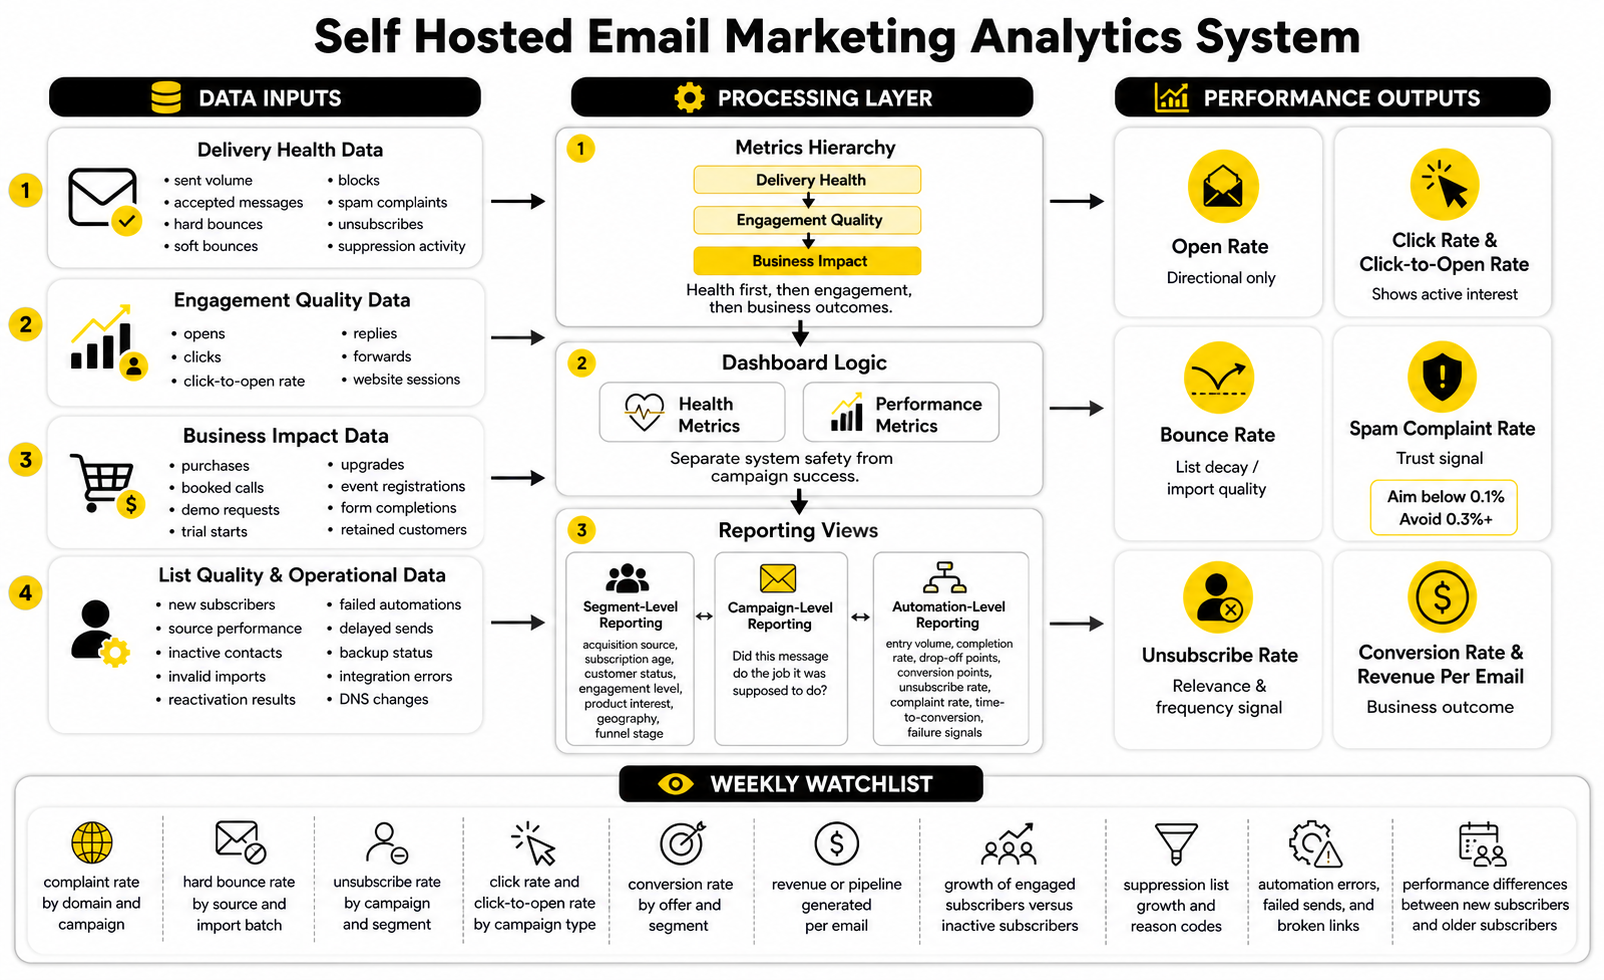
The Metrics Hierarchy
The first layer is delivery health. This includes sent volume, accepted messages, hard bounces, soft bounces, blocks, spam complaints, unsubscribes, and suppression activity. If this layer is unhealthy, every engagement metric above it becomes less useful because the email may not be reaching people cleanly in the first place.
The second layer is engagement quality. Opens, clicks, click-to-open rate, replies, forwards, and website sessions can help you understand whether the message matched the audience. Open rates still have directional value, but they should not be treated as the final truth because privacy features and automated prefetching can distort them.
The third layer is business impact. This is where you track purchases, booked calls, demo requests, trial starts, upgrades, event registrations, form completions, or retained customers. In a serious self hosted email marketing setup, the business layer matters most because it prevents the team from optimizing for vanity metrics.
Benchmarks Are A Compass, Not A Scorecard
Benchmarks are useful when they give you context, not when they become the goal. MailerLite’s 2025 benchmark data reported an average open rate of 43.46% and an average click rate of 2.09%. Mailchimp’s benchmark resource places average opens around 34.23% across its data, with large differences by industry.
Those differences matter. A niche B2B list with high trust may outperform a broad ecommerce list on opens but underperform on immediate clicks. A media newsletter may get strong engagement from educational content, while a sales campaign may show lower clicks but higher revenue per click.
So do not use benchmarks to shame your own numbers. Use them to ask sharper questions. If your click rate is far below comparable campaigns, the issue may be offer relevance, message clarity, link placement, or list quality. If your unsubscribe rate jumps after a specific campaign, the issue may be audience mismatch or frequency.
Open Rate
Open rate can still help you spot broad movement in subject lines, sender recognition, and audience fatigue. If your open rate drops suddenly across multiple segments, something may have changed with deliverability, sending reputation, list quality, or message relevance. If it drops only for one segment, the problem is probably more specific to that audience.
But open rate is not clean enough to carry your reporting alone. Apple’s Mail Privacy Protection and other privacy behavior can inflate or blur open tracking, which means a high open rate does not automatically mean real attention. GetResponse has also noted that engagement increases can be partly influenced by auto-opens generated by privacy features.
The right move is to treat open rate as a directional signal. Use it to compare similar campaigns, similar segments, and similar sending conditions. Do not use it as the primary measure of whether email is making money.
Click Rate And Click-To-Open Rate
Click rate is more useful because it shows active interest. A person has to take a step, follow a link, and show some level of intent. That does not make clicks perfect, but they are usually closer to real engagement than opens.
Click-to-open rate can help you separate subject-line performance from content performance. If opens are strong but click-to-open is weak, the subject line may be doing its job while the body fails to deliver. If opens are weak but click-to-open is strong, the message may be relevant to the people who see it, but the audience size, timing, or inbox placement needs attention.
For self hosted email marketing, this distinction is useful because you control more of the stack. You can look at source, segment, campaign type, offer, landing page, and sending provider behavior in one workflow. That makes it easier to diagnose whether the issue is the list, the message, the infrastructure, or the conversion path.
Bounce Rate
Bounce rate tells you whether your list is decaying, poorly collected, or badly imported. A hard bounce means the address is invalid or no longer exists, and it should be suppressed immediately. A soft bounce may be temporary, but repeated soft bounces should still be watched carefully.
Validity’s 2025 deliverability benchmark explains why reported delivery can be misleading: permission-based email marketing may show bounce rates around 1.5%, making delivery look close to 98.5%, but accepted mail can still land in spam or be blocked at mailbox-provider filtering layers. That distinction is huge. Delivered does not always mean inboxed.
This is why bounce rate should be read beside inbox placement, complaint rate, and engagement. If bounces are low but clicks collapse and complaints rise, the list may be technically valid but no longer receptive. Valid addresses are not the same thing as good subscribers.
Spam Complaint Rate
Spam complaints are one of the clearest warning signals in email marketing. Gmail’s sender guidelines say senders should keep spam rates in Postmaster Tools below 0.30%, while Google’s sender FAQ says senders should aim to stay below 0.1% and avoid ever reaching 0.3% or higher. That means one complaint per thousand messages is already worth attention.
This matters even more in a self hosted setup because you may not have the same built-in guardrails as a large managed email platform. If complaints rise, do not just blame the audience. Look at consent source, list age, targeting, subject line expectations, frequency, and whether the unsubscribe option was obvious.
Complaint rate is not a vanity metric. It is a trust metric. When it moves in the wrong direction, your next action should be restraint: pause risky sends, narrow the audience, clean segments, review acquisition sources, and fix the message before increasing volume again.
Unsubscribe Rate
Unsubscribes are not automatically bad. A visible unsubscribe link lets people leave cleanly instead of hitting the spam button. In that sense, a moderate unsubscribe rate can be healthier than trapping people on a list they no longer want.
MailerLite reported a 2025 average unsubscribe rate of 0.22%, while ActiveCampaign’s benchmark guidance treats anything below 0.5% as generally good. The useful question is not whether your unsubscribe rate matches a generic benchmark. The useful question is whether the rate changes after specific topics, segments, offers, or frequency shifts.
If unsubscribes spike, inspect the campaign honestly. Did the subject line overpromise? Was the offer irrelevant? Did you email a cold segment too aggressively? Did people join for one resource and then receive a completely different kind of message?
Conversion Rate And Revenue Per Email
Conversion rate is where reporting becomes real. It connects email activity to a defined business outcome, such as a sale, application, booking, demo request, account activation, renewal, or reply. Without this layer, the team can easily celebrate a campaign that looked good in email analytics but did almost nothing for the business.
Revenue per email is especially useful for ecommerce, paid newsletters, SaaS upgrades, and offer-driven funnels. It helps you compare campaigns with different list sizes and understand whether smaller, more targeted sends beat larger blasts. In many cases, they do.
For teams using funnel builders or CRM tools around the email system, attribution needs to be planned deliberately. A page builder such as ClickFunnels, a CRM layer such as GoHighLevel, or a form tool such as Fillout can support conversion tracking, but the self hosted email system still needs consistent campaign naming, source fields, and clean links.
How To Build A Useful Reporting Dashboard
A useful dashboard should be simple enough that someone checks it every week. If it takes ten tabs and a technical person to interpret, it will be ignored. The point is not to show every possible metric; the point is to show the few signals that guide action.
Your dashboard should separate health metrics from performance metrics. Health metrics tell you whether the system is safe to keep sending. Performance metrics tell you whether the campaign is doing its job. Mixing them together creates confusion because a campaign can perform well commercially while still damaging list quality if complaints and unsubscribes are ignored.
Start with these reporting groups:
Segment-Level Reporting
Averages hide problems. If one segment loves your emails and another segment ignores or complains about them, the blended campaign report will not tell the truth. Segment-level reporting is how you find the difference.
Look at performance by acquisition source, subscription age, customer status, engagement level, product interest, geography, and funnel stage. This is where self hosted email marketing can be powerful because you can define segments around your actual data model instead of accepting generic categories. The better your data structure, the more useful your reporting becomes.
Segment-level reporting also helps you protect reputation. If cold leads, old imports, or low-intent sources create most of the complaints, you can isolate the issue instead of punishing the entire list. That is how disciplined teams keep scaling without blindly increasing risk.
Campaign-Level Reporting
Campaign-level reporting should answer one question first: did this message do the job it was supposed to do? A product update, a nurture email, a flash sale, a newsletter, and a webinar invitation should not all be judged by the same metric. Each campaign needs a primary goal before it is sent.
For a newsletter, the primary goal may be sustained engagement and clicks to content. For a sales campaign, it may be revenue or booked calls. For a reactivation campaign, it may be identifying who still wants to hear from you and safely suppressing the rest.
This keeps your analysis grounded. Instead of saying “the open rate was good,” you can say “the campaign reached the right segment, kept complaints low, and generated the intended action.” That is a much better way to manage a self hosted email marketing program.
Automation-Level Reporting
Automation reporting needs a slightly different mindset because automations run continuously. You are not only measuring one send. You are measuring a sequence of decisions over time.
Track entry volume, completion rate, drop-off points, conversion points, unsubscribe rate, complaint rate, and time-to-conversion. If a welcome sequence gets strong early clicks but weak final conversions, the issue may be offer timing or final CTA clarity. If a nurture flow creates unsubscribes near one specific email, that message needs review.
Automation reports should also include failure signals. Contacts stuck in the wrong stage, duplicate entries, missing fields, broken links, and failed webhooks can quietly damage performance. Self hosting gives you control, but control only helps when you can see what is happening.
Turning Data Into Better Decisions
Data should lead to action, not endless reporting. If click rates are weak, improve offer clarity, link placement, audience relevance, or content structure. If complaints rise, reduce volume, review consent, clean risky segments, and make unsubscribing easier.
If conversions are weak but clicks are strong, the problem may be after the email. The landing page, offer, pricing, form length, booking flow, or checkout experience may need work. That is where email analytics should connect with funnel analytics instead of sitting in isolation.
For teams that publish across multiple channels, tools like Buffer can help coordinate social distribution around email campaigns, but email should still keep its own performance discipline. Social engagement and email engagement are different signals. Do not blend them into one vague “campaign looked good” report.
The Numbers To Watch Every Week
Weekly measurement keeps small issues from becoming expensive problems. You do not need a giant analytics ritual. You need a repeatable review that shows whether the system is healthy, whether campaigns are relevant, and whether subscribers are moving toward real business outcomes.
Watch these numbers every week:
The point is not to chase perfect numbers. The point is to notice movement early enough to act. That is how self hosted email marketing becomes a managed asset instead of a black box.
Build a stronger local presence with BAAM AI
Turn your website, Google profile, social channels, and AI visibility into one growth engine
Most businesses do not need more random marketing activity. They need a consistent presence system that helps the right people find them, trust them, and take action. BAAM AI brings strategy, local SEO, website updates, Google Maps visibility, social content, AI-search readiness, media production, and reporting into one practical monthly engine.
If you want your marketing to keep working after the campaign ends, start with a free BAAM AI presence audit. See how your business shows up today and where the fastest visibility wins are at BAAM AI.