BAAM AI Blog
Statistics and Data
Measurement is where digital marketing words either become useful or become noise. A dashboard can show hundreds of numbers, but most of them do not deserve equal attention. The job is not to stare at metrics; the...
Measurement is where digital marketing words either become useful or become noise. A dashboard can show hundreds of numbers, but most of them do not deserve equal attention. The job is not to stare at metrics; the job is to understand what the numbers are saying and what action they should trigger.
This matters because digital marketing is now a massive performance environment. U.S. internet advertising revenue reached $294.6 billion in 2025, which shows how much money is flowing through measurable online channels. But bigger spend does not automatically mean better marketing. It means the cost of sloppy measurement is higher.
Good analytics does three things. It shows where attention comes from, what people do after they arrive, and whether those actions create business value. If your data cannot answer those questions, the dashboard may look professional, but it is not helping you make better decisions.
Metric
A metric is a number used to measure performance. In digital marketing, common metrics include impressions, clicks, sessions, engagement rate, conversion rate, cost per click, cost per lead, customer acquisition cost, revenue, retention, and lifetime value. Each metric is useful only when it is connected to a real question.
A metric should not be judged in isolation. A high click-through rate can look good, but it may mean nothing if the clicks come from the wrong audience. A low cost per lead can look efficient, but it may be expensive if those leads never buy.
The practical question is simple: what decision does this metric help you make? If a number does not help you improve targeting, messaging, budget, conversion, retention, or revenue, it may be interesting but not important. That is where many reports go wrong.
KPI
A KPI, or key performance indicator, is a metric that has been promoted to strategic importance. All KPIs are metrics, but not all metrics are KPIs. A KPI should connect directly to the goal of the campaign, channel, team, or business.
For example, impressions may be a KPI for a brand awareness campaign, but they should not be the main KPI for a lead generation campaign. Cost per qualified lead may matter for a service business, while average order value and repeat purchase rate may matter more for ecommerce. The KPI depends on the job the marketing is supposed to do.
This is one of the most important digital marketing words because it forces prioritization. A team that tracks everything often focuses on nothing. A team with clear KPIs knows what success looks like before the campaign begins.
Benchmark
A benchmark is a reference point used to compare performance. Benchmarks can come from industry reports, platform averages, historical account performance, competitor research, or internal goals. They help you understand whether a number is strong, weak, normal, or simply different from what you expected.
Benchmarks are useful, but they are not laws. Email open rates, ad click-through rates, landing page conversion rates, and cost per lead vary heavily by industry, audience, offer, traffic source, brand trust, and buying intent. MailerLite’s 2025 email benchmark analysis shows performance differences across 46 industries and 7 regions, which is a good reminder that context matters.
Use benchmarks to ask better questions, not to copy someone else’s target blindly. If your conversion rate is below a benchmark, the answer is not automatically “redesign the page.” It could be poor traffic quality, weak intent, unclear offer, slow page speed, missing proof, bad targeting, or a mismatch between the ad and the landing page.
Impression
An impression means your content, ad, search result, or placement was shown. It does not mean someone noticed it, read it, trusted it, or cared. It only means the platform counted a display opportunity.
Impressions matter most when you are measuring reach, awareness, frequency, or visibility. They can help you understand whether your message is getting enough exposure to have a chance. But impressions become dangerous when teams treat them like proof of demand.
A campaign with many impressions and few clicks may have a relevance problem. It may also have a creative problem, targeting problem, placement problem, or offer problem. The next action is not to celebrate reach; it is to inspect whether the right people are seeing the right message in the right context.
Click-Through Rate
Click-through rate, often shortened to CTR, measures the percentage of impressions that turn into clicks. It helps show whether the message, placement, and audience are creating enough interest for people to take the next step. CTR is useful because it sits between visibility and traffic.
But CTR is not the same as quality. A curiosity-driven headline can attract clicks that do not convert. A narrow, high-intent message may generate fewer clicks but better leads. That is why CTR should be interpreted with landing page behavior, conversion rate, and lead or revenue quality.
The action behind CTR depends on the pattern. Low impressions and low CTR may suggest weak distribution or poor targeting. High impressions and low CTR may suggest message mismatch. High CTR and low conversion may suggest the promise before the click does not match the experience after the click.
Conversion Rate
Conversion rate measures the percentage of people who complete a desired action. That action could be joining a list, booking a call, buying a product, starting a trial, submitting a form, clicking a button, or completing onboarding. Conversion rate is one of the most useful performance words because it connects attention to action.
A conversion rate is only meaningful when the conversion event is meaningful. A page can convert many visitors into low-quality leads, but that does not mean the campaign is profitable. A more demanding form may reduce total conversions but improve sales quality.
This is why you should define conversion events carefully. A newsletter signup, webinar registration, demo request, checkout, and paid subscription are not equal. They represent different levels of commitment, and they should not be blended together without context.
Key Event
A key event is an important action you choose to track because it matters to the business. In Google Analytics 4, key events are used to measure actions that are important enough to be treated separately from ordinary engagement. Google’s documentation explains that attribution settings decide how reports assign credit to ads, clicks, and other factors before users trigger key events.
This wording matters because not every event deserves strategic attention. A scroll, video view, button click, form start, form submission, checkout, purchase, or booking can all be events. But only some of them indicate real progress toward revenue.
A good analytics setup separates helpful signals from business outcomes. Micro-events can show where people hesitate or engage. Key events should show meaningful movement, such as lead capture, sales conversation, checkout, purchase, upgrade, or retention action.
The Analytics System
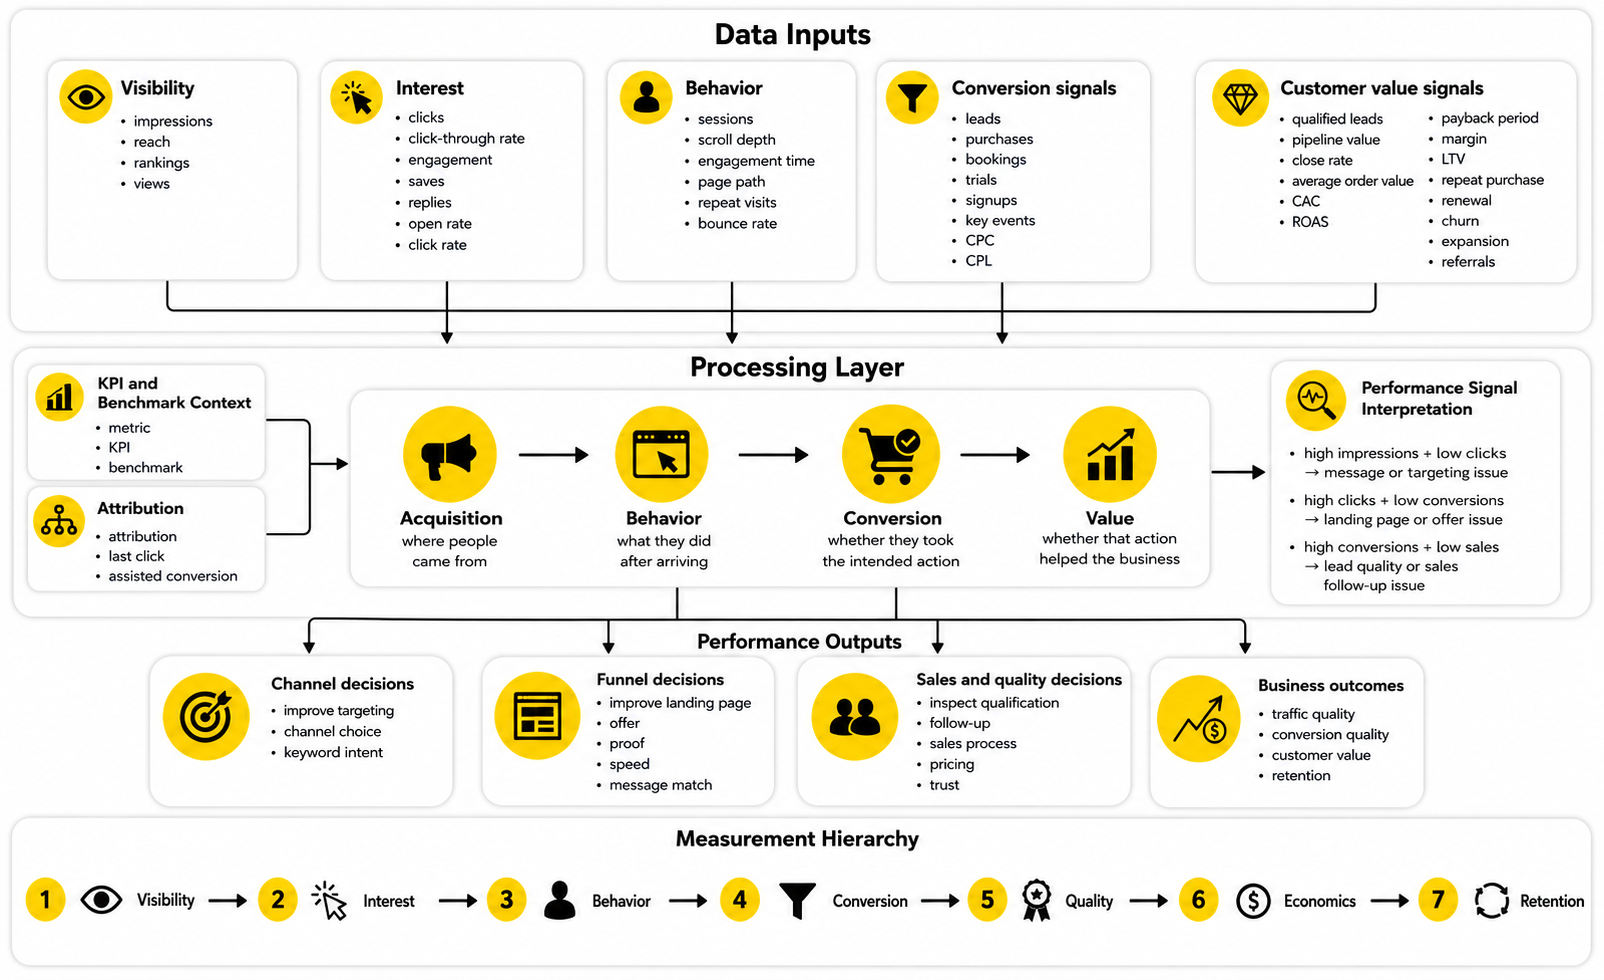
A simple analytics system has four layers: acquisition, behavior, conversion, and value. Acquisition shows where people came from. Behavior shows what they did after arriving. Conversion shows whether they took the intended action. Value shows whether that action helped the business.
This structure keeps measurement practical. If traffic is growing but conversions are flat, you know the issue is probably not awareness alone. If leads are growing but revenue is not, you need to inspect qualification, sales process, pricing, timing, or retention.
The best dashboards make these layers easy to read. They do not just list every available number. They show the path from channel to campaign to visitor behavior to conversion to money, so the next decision becomes obvious.
Attribution
Attribution is the process of assigning credit to marketing touchpoints that influenced a conversion. It tries to answer a difficult question: which channel, campaign, ad, email, search result, or interaction helped create the result? This is useful, but it is never perfect.
Attribution is hard because customer journeys are messy. Someone might discover you through social, search your brand later, read a blog post, join your email list, click a retargeting ad, and then book a call after a referral. A single attribution model may simplify that journey too much.
The practical approach is to treat attribution as a decision tool, not absolute truth. It can help you compare channels, understand touchpoints, and avoid over-crediting the final click. But it should be combined with customer interviews, sales feedback, CRM data, and common sense.
Last Click
Last click attribution gives credit to the final tracked click before the conversion. It is simple, easy to understand, and still common in reporting. The problem is that it can undervalue earlier touchpoints that created awareness, trust, or demand.
For example, a person may read five educational articles, watch several videos, and receive three emails before clicking a branded search ad and converting. Last click may give the branded search ad the credit, even though earlier channels did much of the persuasion. That can lead to bad budget decisions.
Last click is not useless. It can show which touchpoints close demand. But it should not be the only lens if your marketing includes content, social, email, partnerships, creators, or long sales cycles.
Assisted Conversion
An assisted conversion happens when a channel or touchpoint contributes to a conversion without being the final interaction. This idea is important because many digital channels work by influencing decisions before the buyer is ready to act. Content, social, newsletters, communities, and referrals often play this role.
Assisted conversions help you avoid killing channels that are quietly doing important work. A blog post may not directly convert many visitors, but it may introduce people to your brand and later support email, retargeting, or sales conversations. A social profile may not close deals directly, but it can make your company feel familiar before a buyer searches for you.
The action here is to look beyond final-click reports. If a channel rarely closes but often assists, it may deserve a different KPI. Judge it by the role it plays in the journey, not by the role you wish it played.
Cost Per Click
Cost per click, or CPC, shows how much you pay for each click in a paid campaign. It is useful because it helps you understand the cost of buying traffic. But it says nothing by itself about whether the traffic is profitable.
A low CPC can be bad if the visitors are unqualified. A high CPC can be acceptable if the visitors have strong intent and convert into high-value customers. This is why cheap traffic is not always efficient traffic.
The action behind CPC is to connect it with conversion rate and customer value. If CPC rises but lead quality also rises, the campaign may still be healthy. If CPC falls while conversion quality collapses, the campaign may only look better on the surface.
Cost Per Lead
Cost per lead, or CPL, measures how much you spend to generate one lead. This matters for service businesses, agencies, B2B companies, local businesses, and any campaign where the first conversion is not the final sale. It is a useful metric, but it can be misleading when lead quality is ignored.
A form submission is not the same as a qualified opportunity. Some leads are curious, some are not ready, some cannot afford the offer, and some are a perfect fit. If you optimize only for CPL, platforms may find cheaper leads that sales teams hate.
The better question is cost per qualified lead. That pushes marketing and sales to agree on what a good lead actually looks like. If your CRM is clean, a platform like GoHighLevel or Copper can help connect lead source, pipeline stage, and follow-up outcomes instead of stopping at the form fill.
Customer Acquisition Cost
Customer acquisition cost, or CAC, measures how much it costs to acquire a new customer. A simple version divides sales and marketing spend by the number of new customers acquired in the same period. It is one of the most important numbers for understanding whether growth is sustainable.
CAC matters because marketing can look successful while the business model quietly breaks. A campaign may generate many leads and customers, but if acquiring each customer costs too much relative to revenue and margin, the growth is not healthy. This is especially important when paid media costs rise or conversion rates fall.
The action is to compare CAC with lifetime value, payback period, gross margin, and retention. A high CAC can work if customers stay, spend more, and generate strong margin. A low CAC can still be dangerous if customers churn quickly or require heavy service costs.
Return on Ad Spend
Return on ad spend, or ROAS, compares revenue generated from ads with the amount spent on ads. If a campaign spends $1,000 and produces $4,000 in tracked revenue, the ROAS is 4:1. That sounds clean, but it needs careful interpretation.
ROAS does not automatically equal profit. It usually ignores product costs, fees, shipping, discounts, refunds, sales team costs, software costs, and fulfillment costs unless those are added separately. For ecommerce, this distinction is critical.
The action is to know your break-even point. A 3:1 ROAS might be excellent for one business and terrible for another. Without margin and lifetime value, ROAS can become a vanity metric with a calculator attached.
Lifetime Value
Lifetime value, or LTV, estimates how much revenue or profit a customer creates over the relationship with the business. It helps you understand how much you can afford to spend to acquire and keep customers. This is where acquisition, retention, pricing, and product quality come together.
LTV is useful because not all customers are equal. Some buy once and disappear. Others renew, upgrade, refer, and buy additional products. If you treat both groups the same in your marketing math, your budget decisions will be blunt.
The action is to improve both acquisition quality and customer experience. Better targeting can bring in customers with stronger fit. Better onboarding, support, email, product education, and retention campaigns can increase the value of customers you already have.
Engagement Rate
Engagement rate measures how often people interact with content compared with the number of people who saw it or follow the account. It can include likes, comments, shares, saves, clicks, replies, reactions, or other platform-specific actions. It is useful for understanding resonance, but it is not the same as revenue.
Engagement is strongest when it tells you what people care about. A post with many saves may reveal a practical topic worth expanding. A video with strong comments may show a pain point that deserves a landing page, email sequence, or product angle.
The mistake is chasing engagement for its own sake. Controversial, funny, or emotionally charged content may perform well while attracting the wrong audience. Engagement should guide learning, but it should not replace business outcomes.
Open Rate
Open rate measures the percentage of delivered emails that are opened. It can help show whether your sender name, subject line, audience relationship, and timing are creating enough interest. But open rate has become less precise because privacy features and inbox behavior can affect tracking.
That does not mean open rate is useless. It can still show directional trends inside your own list. If your open rate drops sharply after a list change, subject line shift, or sending frequency increase, something may be wrong.
The better move is to pair open rate with clicks, replies, conversions, unsubscribes, spam complaints, and revenue. A campaign with fewer opens but more qualified replies may be better than one with high opens and no action. Email numbers only matter when they connect to the relationship you are trying to build.
Click Rate
Click rate measures how many recipients clicked a link in an email, ad, page, or message. In email marketing, it often tells you whether the content and call to action were relevant enough to move people forward. It is closer to intent than an open, but still not the final answer.
A low click rate may mean the offer was weak, the email was unclear, the audience segment was wrong, or the call to action did not fit the reader’s stage. A high click rate may mean strong interest, but you still need to see what happens after the click. The landing page, checkout, booking page, or form has to continue the promise.
This is where tools and tracking need to support the strategy. Email platforms like Brevo or Moosend can show campaign clicks, but the real insight comes from connecting those clicks to conversions, pipeline, purchases, and retention.
Bounce Rate and Engagement Time
Bounce rate traditionally describes visits where someone leaves without meaningful interaction. In modern analytics, it is often more useful to look at engaged sessions, engagement time, scroll depth, and key actions. The exact definition depends on the analytics platform, so teams need to be clear about what they are measuring.
A high bounce rate is not always bad. A simple blog post may answer a question quickly, and the visitor may leave satisfied. A high bounce rate on a paid landing page, checkout page, or demo page is more concerning because the page has a clear action it is supposed to drive.
The action is to interpret behavior by page type. Educational pages, product pages, pricing pages, and conversion pages should not be judged the same way. The metric has to match the purpose of the page.
What the Numbers Should Actually Change
Data should change decisions. If the numbers do not influence what you create, stop, fix, test, spend, or prioritize, then the measurement system is mostly decoration. That sounds harsh, but it is true.
A useful performance review should lead to clear action. If traffic quality is poor, improve targeting, channel choice, or keyword intent. If people click but do not convert, improve the landing page, offer, proof, speed, or message match. If leads convert but do not buy, inspect qualification, follow-up, sales process, pricing, and trust.
The best teams do not worship dashboards. They use them to find friction. Then they fix the part of the system that is actually holding growth back.
How to Read Performance Signals
Performance signals are clues, not final verdicts. A single metric rarely tells the whole story. You need to read patterns across the journey.
If impressions are high but clicks are low, the message may not be relevant enough. If clicks are high but conversions are low, the landing page or offer may be weak. If conversions are high but sales are low, lead quality or sales follow-up may be the issue.
This is the practical way to use digital marketing words in analytics. Each word points to a different part of the system. When you know what each metric means, you can diagnose performance without guessing.
The Measurement Hierarchy
A clean measurement hierarchy moves from visibility to business value. This keeps the team from celebrating early-stage metrics while ignoring whether the business is actually improving. It also helps you choose the right KPI for the right campaign.
The hierarchy looks like this:
This framework prevents lazy reporting. A top-of-funnel campaign should not be judged only by immediate sales if its job is awareness. A bottom-of-funnel campaign should not hide behind impressions if its job is conversion. The metric has to match the mission.
Why Benchmarks Should Not Replace Judgment
Benchmarks can help you spot problems, but they cannot understand your business for you. A campaign selling a $29 digital product should not be judged the same way as a campaign selling a $15,000 consulting engagement. The numbers live in different buying contexts.
This is why internal benchmarks are often more useful than broad industry averages. Your own account history can show whether performance is improving or declining under similar conditions. Once you know your baseline, external benchmarks become a sanity check instead of a scoreboard.
Use benchmarks to guide investigation. Do not let them make decisions automatically. A number is only useful when you understand the audience, offer, channel, intent, and economics behind it.
How Measurement Prepares Professional Implementation
Analytics connects the earlier sections of the article to the implementation work that comes next. Strategy defines who you serve and why they care. Channels bring people into the system. Measurement shows whether the system is working.
The next step is professional implementation. That means turning the vocabulary into workflows, tools, ownership, automation, reporting, and continuous improvement. This is where digital marketing stops being a collection of terms and becomes a repeatable growth process.
Build a stronger local presence with BAAM AI
Turn your website, Google profile, social channels, and AI visibility into one growth engine
Most businesses do not need more random marketing activity. They need a consistent presence system that helps the right people find them, trust them, and take action. BAAM AI brings strategy, local SEO, website updates, Google Maps visibility, social content, AI-search readiness, media production, and reporting into one practical monthly engine.
If you want your marketing to keep working after the campaign ends, start with a free BAAM AI presence audit. See how your business shows up today and where the fastest visibility wins are at BAAM AI.