BAAM AI Blog
Statistics And Data
Measurement is where ecommerce email gets real. It is easy to feel productive because emails are being sent, flows are live, and campaigns are going out every week. But activity is not performance, and performance is...
Measurement is where ecommerce email gets real. It is easy to feel productive because emails are being sent, flows are live, and campaigns are going out every week. But activity is not performance, and performance is not always obvious from one metric.
The numbers only matter when they help you make a better decision. A high open rate can look impressive, but it does not pay the bills. A low click rate can look scary, but it might be normal for a low-intent campaign. A flow that sends fewer emails can still be more valuable than a campaign that reaches the entire list if it reaches people at the right moment.
This is why ecommerce email analytics should not be treated like a scoreboard. Treat it like a diagnostic system. The job is to understand what is happening, why it is happening, and what action should come next.
Benchmarks Are Useful, But Only In Context
Benchmarks help you spot whether performance is obviously weak, average, or unusually strong. They are not targets you blindly chase. A welcome flow, abandoned cart flow, winback flow, and promotional campaign all have different intent levels, so comparing them against one generic email average will give you bad conclusions.
That is why modern ecommerce benchmark reports separate campaign performance from automation performance. The 2025 Klaviyo benchmark report breaks down email performance by message type because a welcome email and an abandoned cart email are not trying to solve the same problem. The 2025 Omnisend ecommerce marketing report also separates automated and scheduled messages because automation usually reflects stronger customer intent.
Use benchmarks as a comparison point, not a verdict. If your abandoned cart flow is below the benchmark, the next question is not “How do we copy someone else’s flow?” The better question is whether your offer, timing, product page, checkout experience, email creative, shipping clarity, or audience quality is creating friction.
The Metrics That Actually Matter
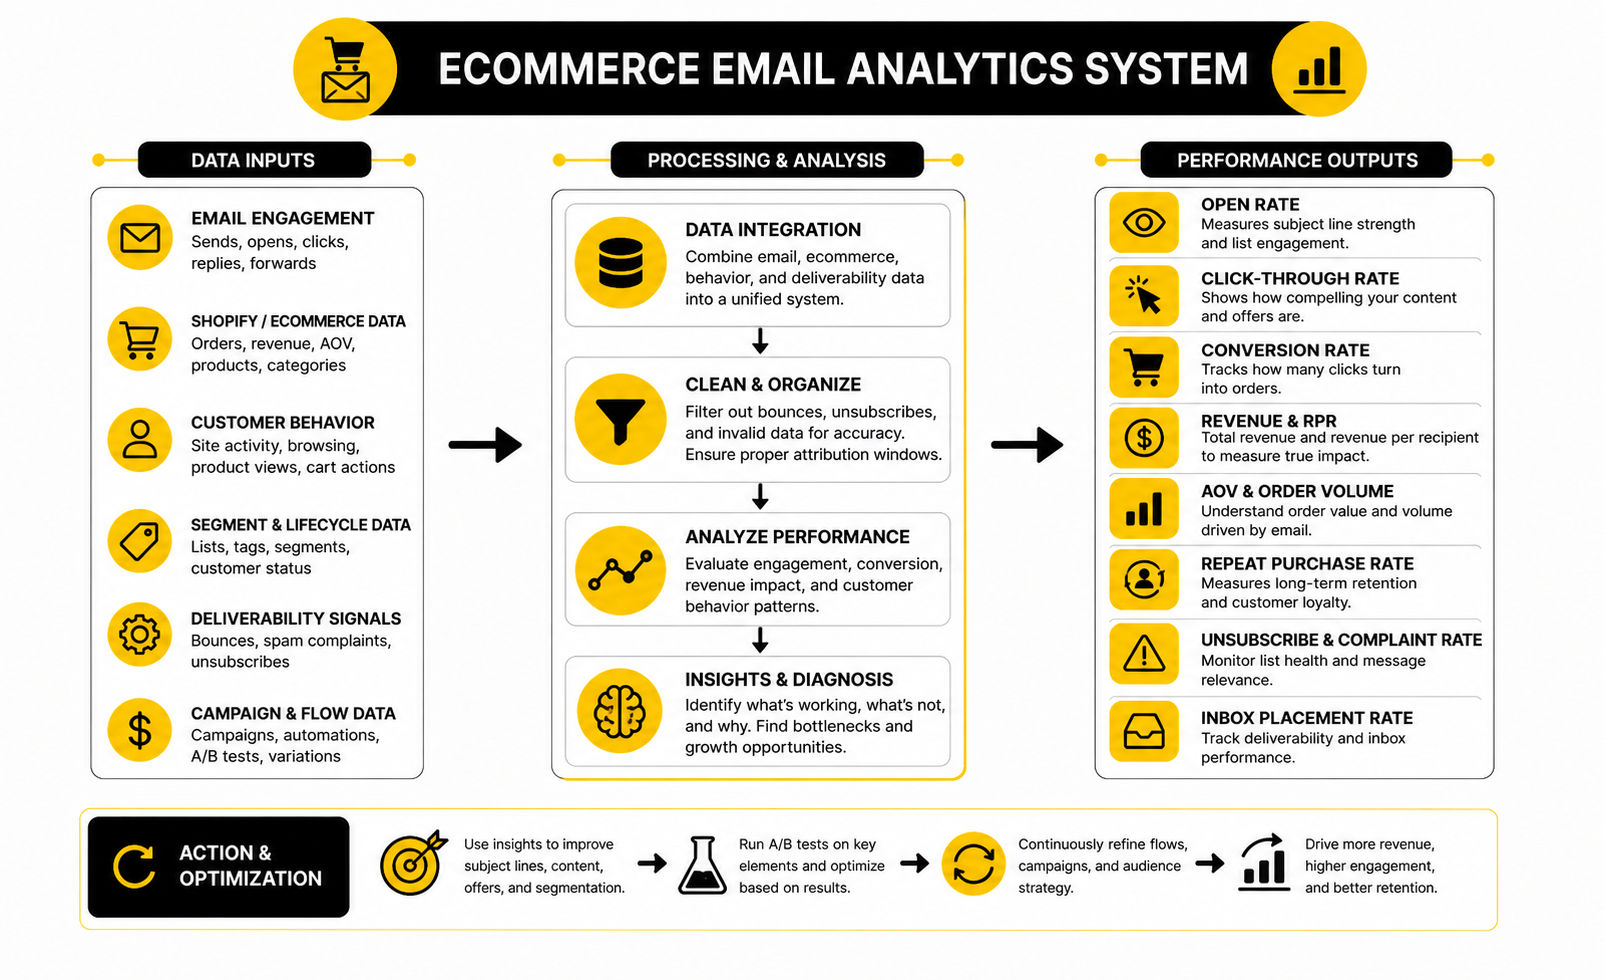
A healthy ecommerce email dashboard should separate engagement, revenue, deliverability, and list health. When those numbers are mixed together, teams often optimize the wrong thing. For example, improving opens does not mean much if revenue per recipient is flat and unsubscribes are rising.
The core metrics to monitor are:
Revenue per recipient is especially useful because it connects email performance to audience quality. A campaign sent to 20,000 people might generate more total sales than a campaign sent to 3,000 people, but the smaller campaign may be much stronger if it produces more revenue per recipient. This keeps you from celebrating volume when the real win is relevance.
Placed order rate and click rate tell you different things. Click rate shows whether the email created enough interest to move someone forward. Placed order rate shows whether that interest turned into a purchase. If clicks are strong but orders are weak, the problem may be the landing page, product offer, pricing, shipping, or checkout process rather than the email itself.
Why Open Rate Is No Longer Enough
Open rate still has some directional value, but it should not be the main measure of ecommerce email performance. Apple’s Mail Privacy Protection changed open tracking by preloading email images for many Apple Mail users, which can make opens look higher or less reliable than actual human behavior. That is why the 2025 Klaviyo benchmark report directly notes that open rates are less reliable after Apple’s iOS 15 update.
This does not mean open rate is useless. It can still help compare subject lines within the same list, sender, and time period. But it should be treated as a soft signal, not the final truth.
The better move is to focus on action-based metrics. Clicks, purchases, replies, unsubscribes, spam complaints, and revenue are harder to fake and more connected to business outcomes. If an email gets average opens but strong revenue per recipient, it is doing its job.
Flow Revenue Versus Campaign Revenue
One of the most important ecommerce email measurements is the split between flow revenue and campaign revenue. Flows usually capture behavior-driven intent. Campaigns usually create demand or reactivate attention. Both matter, but they tell you different things about the business.
If campaign revenue is strong but flow revenue is weak, the brand may be relying too much on manual promotion. That usually means important lifecycle moments are being missed or underbuilt. Welcome, browse abandonment, cart abandonment, checkout abandonment, post-purchase, review request, cross-sell, and winback flows should all have clear ownership.
If flow revenue is strong but campaign revenue is weak, the brand may have good automation but a weak content or merchandising calendar. That can happen when the team has technical flows set up but lacks strong reasons to email the broader list. In that case, the fix is not more automation; it is better campaign strategy.
The healthiest programs usually have both. Flows capture high-intent moments automatically. Campaigns create fresh reasons to engage, buy, learn, and return.
How To Read The Analytics System
A useful analytics system should answer four questions. First, are emails reaching people? Second, are people engaging? Third, are they buying? Fourth, is the list becoming healthier or weaker over time?
Deliverability answers the first question. Look at bounce rate, spam complaints, domain reputation signals, inbox placement testing when available, and whether engagement is declining across major inbox providers. Google’s sender guidance says bulk senders should keep user-reported spam rates below the high-risk threshold described in its email sender guidelines, so complaint rate is not a vanity metric. It is an inbox access metric.
Engagement answers the second question. Click rate, click-to-open rate, replies, preference updates, and site visits from email show whether people care enough to act. If engagement falls across the whole list, the issue may be audience quality, sending frequency, content relevance, or offer fatigue.
Revenue answers the third question. Track placed orders, revenue per recipient, average order value, and conversion rate after click by flow and campaign type. Do not lump everything together because that hides the most useful signals.
List health answers the fourth question. A growing list is not automatically a healthy list. If new subscribers do not click, buy, or stay subscribed, you are just adding future deliverability risk.
What The Data Should Make You Do
Data should lead to action, not just reporting. If a metric is weak, there should be a logical next move. If a metric is strong, there should be a way to understand why and apply that learning elsewhere.
Here is the practical interpretation:
This is the difference between reporting and management. Reporting says, “The click rate was 1.8%.” Management says, “The click rate dropped on broad promotional sends, so we need tighter segmentation, a clearer offer, and a more relevant landing page.”
Testing Without Fooling Yourself
Testing is useful only when the test is clean enough to trust. Changing the subject line, offer, audience, creative, send time, and landing page at the same time does not tell you what worked. It only tells you that a bundle of changes performed differently.
Start with tests that connect to a business question. If the issue is low clicks, test the angle, offer, creative hierarchy, or call to action. If the issue is low purchases after click, test the landing page, product bundle, guarantee, shipping threshold, or checkout clarity.
Do not overtest tiny details before the fundamentals are strong. Button color is not the issue if the offer is weak. Preview text is not the issue if the audience is wrong. A subject line test will not save an ecommerce email program that lacks strong lifecycle flows.
The clean testing rhythm is simple:
That rhythm compounds. It also keeps the team from chasing random “growth hacks” that make the account messier but not more profitable.
The Monthly Review
Ecommerce email should be reviewed monthly, not only when revenue drops. A monthly review gives you enough data to see patterns without reacting emotionally to every campaign. It also creates accountability for the system instead of leaving performance buried inside platform dashboards.
A useful monthly review should cover:
Keep the review practical. The point is not to create a 40-slide report nobody uses. The point is to decide what gets fixed, what gets scaled, and what gets tested next.
If your ecommerce email platform makes these numbers hard to see, that is a problem. Tools like Brevo, Moosend, and GoHighLevel are worth comparing based on how clearly they show automation performance, campaign performance, segmentation, and revenue attribution. The best tool is not the one with the prettiest dashboard. It is the one that helps you make better decisions faster.
Build a stronger local presence with BAAM AI
Turn your website, Google profile, social channels, and AI visibility into one growth engine
Most businesses do not need more random marketing activity. They need a consistent presence system that helps the right people find them, trust them, and take action. BAAM AI brings strategy, local SEO, website updates, Google Maps visibility, social content, AI-search readiness, media production, and reporting into one practical monthly engine.
If you want your marketing to keep working after the campaign ends, start with a free BAAM AI presence audit. See how your business shows up today and where the fastest visibility wins are at BAAM AI.