BAAM AI Blog
Statistics And Data
Measurement is where email marketing for financial services becomes honest. A campaign can look polished, sound professional, and still fail if the right people are not opening, clicking, replying, booking, applying...
Measurement is where email marketing for financial services becomes honest. A campaign can look polished, sound professional, and still fail if the right people are not opening, clicking, replying, booking, applying, renewing, or taking the next step. The numbers are not there to make reports look impressive. They are there to show what the audience is actually doing.
The tricky part is that email metrics can be misleading when they are read in isolation. A high open rate does not always mean strong trust. A low click rate does not always mean the email failed. A small unsubscribe spike may be healthy if it removes people who were never a fit. The goal is not to chase one perfect benchmark. The goal is to understand what each signal means and what action it should drive.
The Metrics That Actually Matter
Open rate still has some value, but it should not be treated as the main performance metric. Privacy changes and automatic image loading have made opens less reliable than they used to be. If an email has a strong open rate but weak clicks, replies, and booked actions, the subject line may be doing its job while the message itself is not moving the reader forward.
Click rate is usually more useful because it shows active intent. In financial services, a click can mean the reader wants to compare options, read a guide, schedule a consultation, upload a document, review a renewal, or understand a decision more deeply. That makes clicks more valuable than passive opens, especially when the email is tied to a clear next step.
Conversion rate is the metric that connects marketing to business value. For a financial advisor, that might mean booked consultations. For a lender, it could mean completed applications. For an insurance provider, it could mean renewal reviews. For a fintech company, it might mean activated accounts or completed onboarding. This is where the email program proves whether it is creating outcomes, not just activity.
How To Read Benchmarks Without Misusing Them
Benchmarks are useful, but only as a reference point. They should help a team spot obvious underperformance, not dictate strategy. A financial services newsletter sent to loyal clients should not be judged the same way as a cold lead nurture sequence. A transactional onboarding email should not be judged the same way as a monthly educational campaign.
Recent benchmark data shows why context matters. MailerLite’s 2025 benchmark data put the average email open rate at 43.46%, average click rate at 2.09%, and average unsubscribe rate at 0.22% in its email marketing benchmarks by industry and region. The DMA’s 2025 benchmarking report found delivery rates at 98% in 2024, open rates at 35.9%, and unique click rates at 2.3% in its email benchmarking report. Those numbers are helpful, but they are not universal targets for every financial firm.
For email marketing for financial services, the better question is not “Are we above the average?” The better question is “Are the right people taking the right next step?” A campaign with a modest click rate but high-quality consultation bookings may be more valuable than a campaign with a flashy open rate and no serious intent.
Deliverability Signals
Deliverability is the first measurement layer because every other metric depends on it. If the emails do not reach the inbox, the campaign cannot educate, convert, retain, or build trust. That makes authentication, bounce rates, complaint rates, unsubscribe behavior, and inbox placement part of the marketing dashboard.
Gmail’s sender guidance defines a bulk sender as one that sends close to 5,000 or more messages to personal Gmail accounts in a 24-hour period and tells senders to keep spam rates below 0.10% while avoiding 0.30% or higher in its sender guidelines. Validity’s 2025 deliverability benchmark also warned that best-in-class senders should aim to stay consistently below 0.1% complaint rates in its email deliverability benchmark report. That is a tiny margin. One complaint in 1,000 emails already reaches 0.1%.
This is why complaint rate is more than a technical number. It is a trust signal. If complaints rise, the firm should not only check authentication and sending infrastructure. It should also review the audience, frequency, promise, subject line, and whether the email matched the reason people subscribed in the first place.
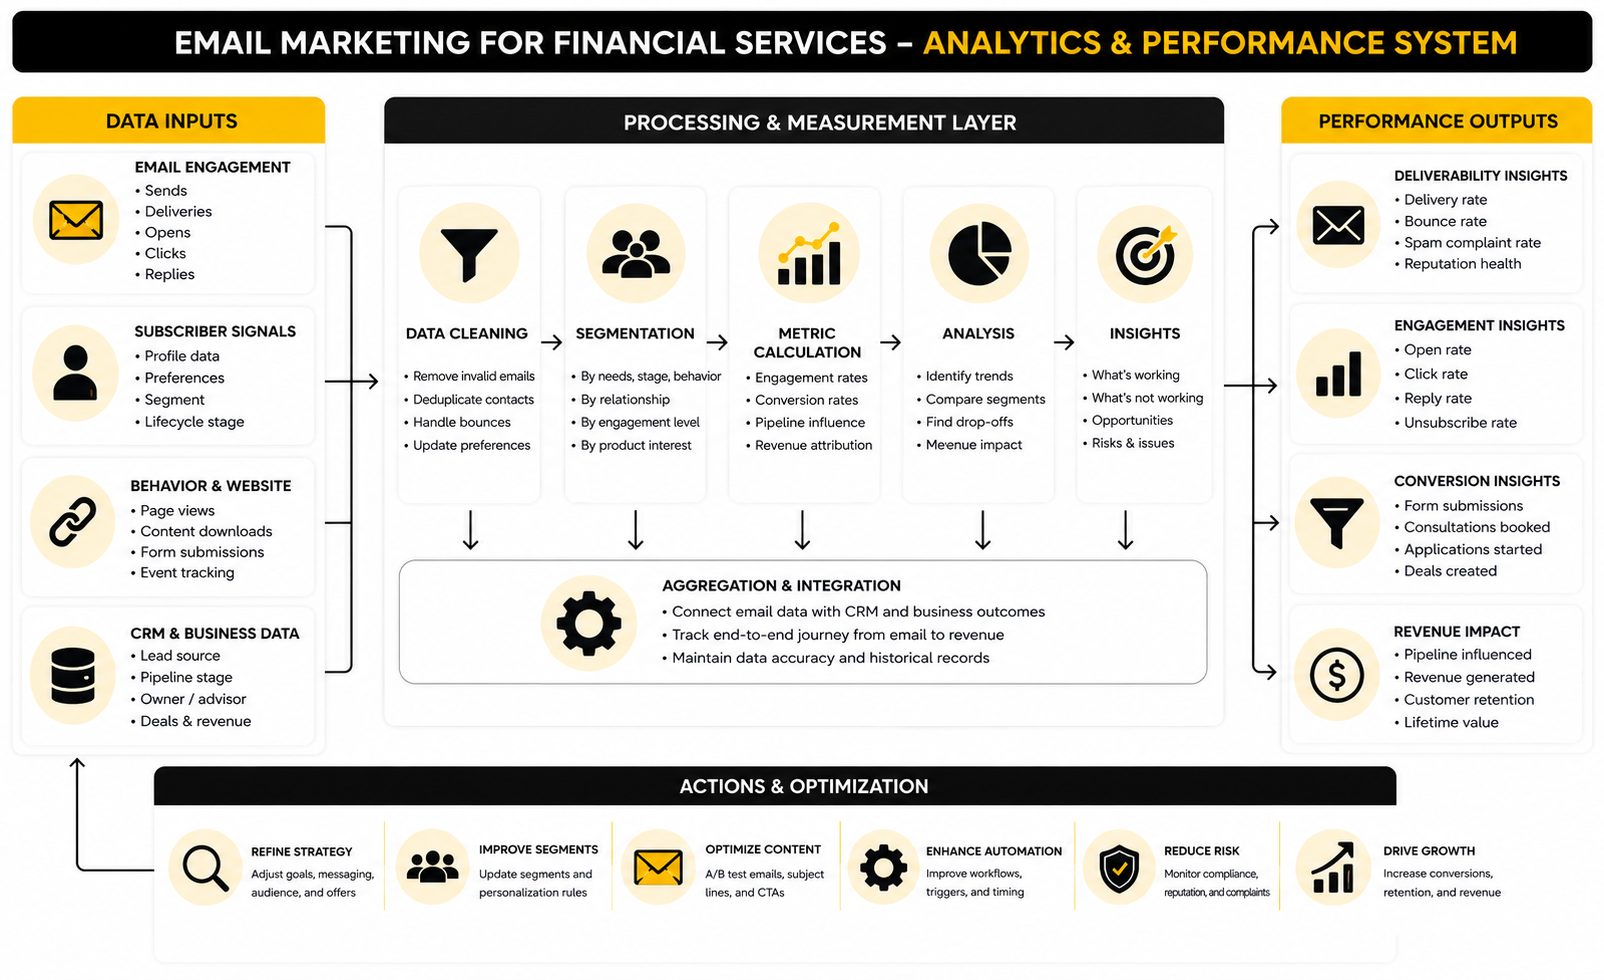
A practical analytics system should track four layers together:
The reason this structure works is simple. It prevents teams from obsessing over surface-level engagement when the deeper journey is broken. If inbox health is weak, fix deliverability first. If engagement is weak, fix segmentation and message relevance. If engagement is strong but journey movement is weak, fix the landing page, booking flow, form, offer, or follow-up process.
Engagement Signals
Engagement tells you whether the content is earning attention. Opens show the first layer of interest, but clicks, replies, and repeat interactions show stronger intent. In financial services, replies can be especially valuable because a serious prospect may ask a question before booking a formal appointment.
Click-to-open rate can help diagnose the gap between subject line promise and email content. If many people open but few click, the subject line may be stronger than the body of the email. The content may be too broad, too long, too sales-heavy, or unclear about what the reader should do next. If few people open but those who do open click at a strong rate, the offer may be relevant but the subject line, sender name, timing, or list segment needs work.
Unsubscribes also need a calm interpretation. A low unsubscribe rate is not always good if people are ignoring the email instead of opting out. A slight increase can be healthy after a list cleanup, repositioning, or tighter segmentation. What matters is whether unsubscribes are paired with spam complaints. Unsubscribes are normal. Spam complaints are a warning.
Journey And Revenue Metrics
The most important measurement layer is what happens after the click. This is where many firms under-measure their email program. They know the email got clicks, but they cannot clearly see whether those clicks became consultations, applications, document uploads, renewals, or funded accounts.
This is a process problem, not just a reporting problem. The CRM, email platform, forms, calendar, and pipeline need to connect cleanly enough to show movement. A team using GoHighLevel can connect email follow-up with pipeline stages and booked appointments. A team using Fillout for intake forms and Cal.com for scheduling should still define exactly which form completions and bookings count as meaningful conversions.
Revenue attribution should be practical, not theatrical. Financial services often involve long sales cycles, multiple touchpoints, referrals, calls, branch visits, advisor conversations, and compliance steps. Email may not deserve 100% credit for a new client, but it may have influenced the decision by educating the prospect, keeping the firm top of mind, or reducing friction before the meeting.
What The Data Should Make You Do
Data is only useful when it changes behavior. If the numbers do not lead to decisions, the dashboard is just decoration. Every metric should have a clear response attached to it.
If open rates are weak, review the sender name, subject line, preview text, send timing, and whether the audience recognizes the value of the message. If clicks are weak, tighten the email around one idea and one action. If conversions are weak after clicks, fix the landing page, calendar flow, form length, offer clarity, or follow-up speed.
If spam complaints rise, stop sending more volume until the cause is clear. Check whether the list source is weak, the message is too promotional, the frequency changed too quickly, or the unsubscribe process is not obvious enough. This is one of those places where being aggressive is expensive. Protecting sender reputation matters more than squeezing out one more campaign.
Testing Without Creating Noise
Testing should improve the email program, not create random experiments. A financial services firm does not need to test everything at once. It needs focused tests that answer one useful question.
Start with the highest-impact variables: audience segment, subject line, offer, call to action, send timing, and content format. Test one main variable at a time when possible. If the team changes the audience, subject line, email body, and landing page all at once, it becomes hard to know what actually caused the result.
Good tests are tied to business intent. For example, a firm might test whether an educational checklist drives more qualified consultation bookings than a general market commentary email. A lender might test whether document-preparation reminders reduce application drop-off. An insurance provider might test whether renewal education sent earlier improves review bookings. The point is not to “win” a test. The point is to learn what helps the reader move forward with more confidence.
Reporting Cadence
Weekly reporting should focus on operational health. That means delivery, bounces, complaints, unsubscribes, broken links, and any unusual performance changes. This keeps small problems from turning into sender reputation issues or campaign failures.
Monthly reporting should focus on engagement and journey movement. Which segments are responding? Which topics are getting serious clicks? Which campaigns are creating booked appointments, form submissions, applications, or renewal actions? This is where the team decides what to repeat, improve, pause, or rebuild.
Quarterly reporting should connect email performance to business outcomes. That includes pipeline influence, conversion quality, retention signals, cost efficiency, and content themes that created the strongest downstream results. This is also the right time to review list growth quality, compliance workflow, and whether the strategy still matches the firm’s priorities. Measurement is not the end of the program. It is the feedback loop that makes every future campaign sharper.
Build a stronger local presence with BAAM AI
Turn your website, Google profile, social channels, and AI visibility into one growth engine
Most businesses do not need more random marketing activity. They need a consistent presence system that helps the right people find them, trust them, and take action. BAAM AI brings strategy, local SEO, website updates, Google Maps visibility, social content, AI-search readiness, media production, and reporting into one practical monthly engine.
If you want your marketing to keep working after the campaign ends, start with a free BAAM AI presence audit. See how your business shows up today and where the fastest visibility wins are at BAAM AI.