BAAM AI Blog
Market Line: How Professionals Read Risk, Return, and Portfolio Efficiency
A market line is one of the cleanest ways to see whether risk is being rewarded properly. In finance, the phrase usually points to two related ideas: the capital market line, which compares efficient portfolios by...

A market line is one of the cleanest ways to see whether risk is being rewarded properly. In finance, the phrase usually points to two related ideas: the capital market line, which compares efficient portfolios by total risk, and the security market line, which compares individual assets or portfolios by market risk. Both help answer the same practical question: are you getting enough expected return for the risk you are taking?
That question matters because most investment mistakes are not caused by risk alone. They are caused by taking the wrong kind of risk, paying too much for it, or assuming that a higher-return asset is automatically a better asset. The market line gives analysts, portfolio managers, and serious investors a disciplined way to separate useful risk from unrewarded noise.
The foundation goes back to Harry Markowitz’s work on portfolio selection, where risk and return were evaluated at the portfolio level rather than asset by asset. The original 1952 portfolio selection paper introduced the logic behind efficient portfolios, and later CAPM research connected that portfolio logic to expected returns in market equilibrium. The result is not a magic formula, but it is a powerful framework for thinking clearly.
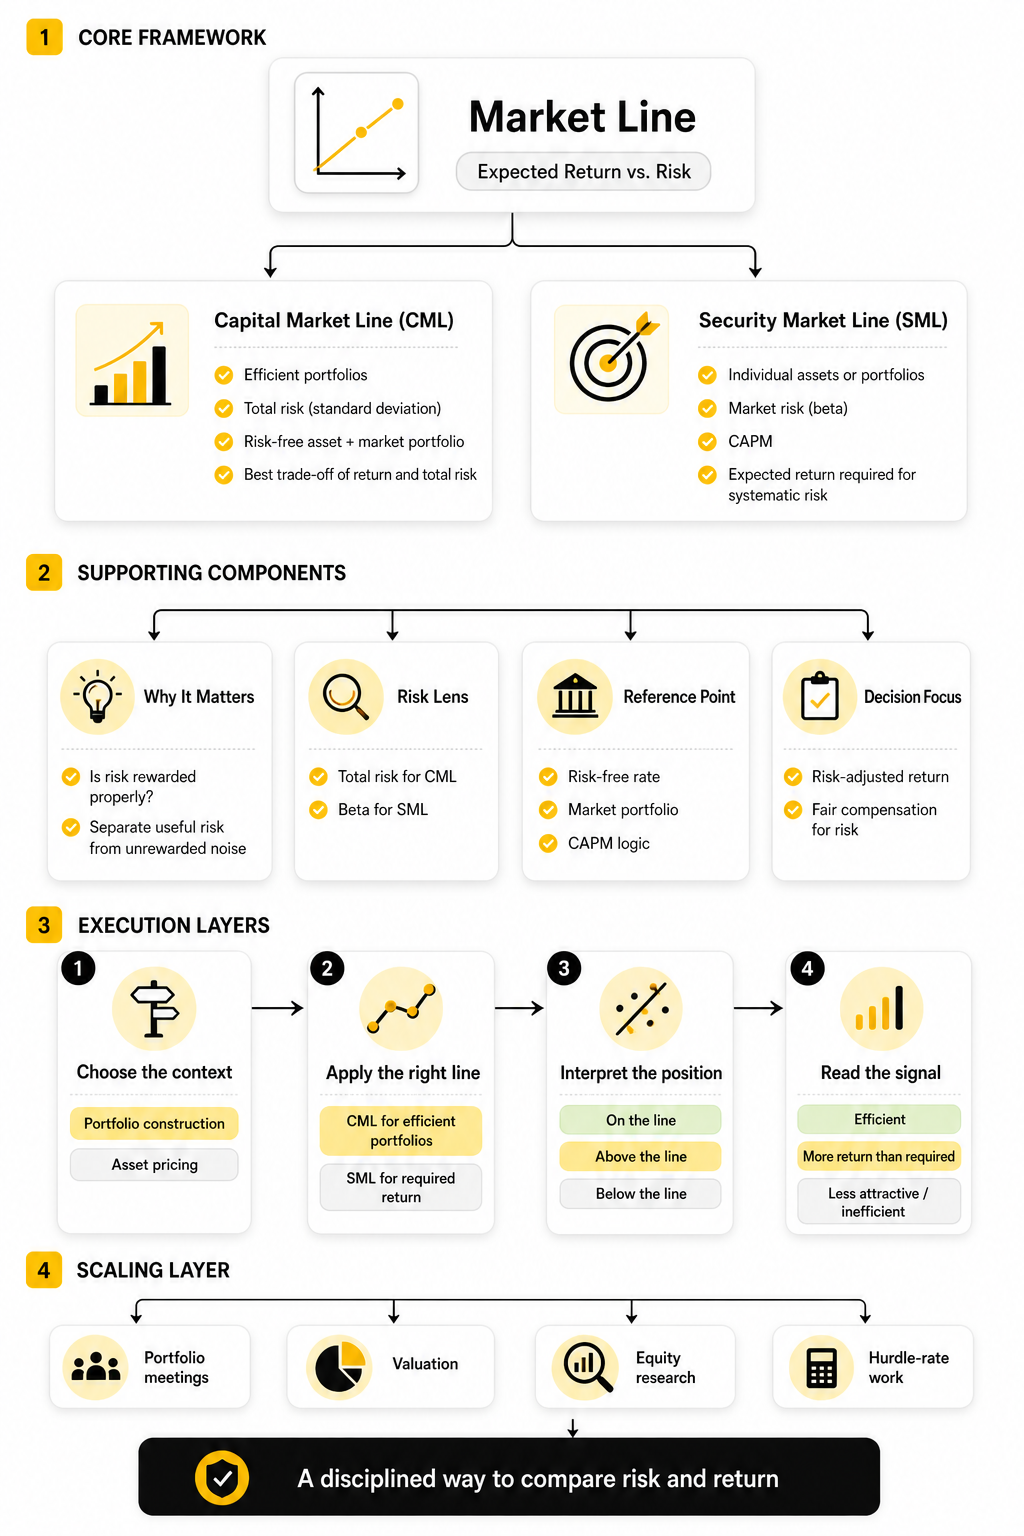
this guide is split into six parts so each idea builds naturally instead of forcing every formula, interpretation, and limitation into one dense explanation. The section names below are the real section names the full article will continue using. By the end, you will understand what a market line is, how professionals interpret it, and where the framework becomes dangerous if used too mechanically.
Market Line Meaning and Why It Matters
A market line is a visual model that connects expected return to a specific measure of risk. The capital market line uses portfolio standard deviation, while the security market line uses beta, which measures sensitivity to broad market movements. That difference is not academic trivia because it changes what the line is actually telling you.
The CFA Institute’s portfolio risk and return reading describes the capital market line as a special case of the capital allocation line where the efficient risky portfolio is the market portfolio. In plain English, that means the line shows the best available blend of a risk-free asset and a diversified market portfolio under the model’s assumptions. Anything below that line is inefficient because another combination offers a better expected return for the same level of total risk.
The security market line works differently because it comes from the Capital Asset Pricing Model. Instead of asking whether a whole portfolio is efficient by total volatility, it asks whether a security’s expected return is fair for its systematic risk. Fama and French’s review of CAPM theory and evidence is useful here because it shows both why the model became central and why professionals should avoid treating it as perfect.
Framework Overview: Capital Market Line vs. Security Market Line
The capital market line is mainly a portfolio construction tool. It starts with a risk-free rate, touches the efficient frontier at the market portfolio, and then extends upward as investors take more market exposure or use leverage. Its job is to show the best theoretical trade-off between expected return and total portfolio risk.
The security market line is mainly an asset pricing and required return tool. It starts with the risk-free rate, rises with beta, and shows the expected return an investor should require for bearing systematic market risk. If an asset plots above the line, it appears to offer more expected return than the model requires; if it plots below the line, it appears less attractive on a risk-adjusted basis.
This is why the phrase market line needs context. In a portfolio meeting, it may mean the capital market line and the search for efficient risk-return combinations. In valuation, equity research, or hurdle-rate work, it often means the security market line and the return required for a given beta. Both are useful, but mixing them up leads to sloppy analysis.
Core Components of a Market Line
A market line looks simple because it is drawn as a straight line, but every point on it is doing a specific job. The vertical axis shows expected return, while the horizontal axis shows the risk measure used by that version of the model. For the capital market line, the risk measure is total portfolio volatility; for the security market line, the risk measure is beta.
The first component is the risk-free rate. This is the starting point of the line because it represents the return investors can theoretically earn without taking risky-asset exposure. In practice, analysts often use government securities as a proxy, and the U.S. Treasury daily yield curve is one common reference point for dollar-based analysis.
The second component is the market risk premium. This is the extra return investors expect for holding the market portfolio instead of the risk-free asset. It is not a fixed number carved into stone, which is exactly why professional analysts revisit assumptions as rates, valuations, earnings expectations, and macro conditions change.
The third component is the slope of the market line. On the capital market line, the slope represents the reward per unit of total portfolio risk, which is closely related to the Sharpe ratio. On the security market line, the slope represents the market risk premium per unit of beta, which is why beta becomes so important when estimating required return.
The fourth component is the asset or portfolio being tested. A portfolio on the capital market line is theoretically efficient under the model’s assumptions, while a portfolio below it is not being compensated well enough for its total volatility. An asset above the security market line appears undervalued relative to its systematic risk, while an asset below it appears overvalued.
Risk-Free Rate: The Starting Point That Moves Everything
The risk-free rate is not just a harmless input. Move it, and the entire market line shifts. That means the same stock, fund, or portfolio can look attractive in one rate environment and much less attractive in another.
This became painfully obvious after the ultra-low-rate period ended. When cash and short-term government securities offered almost nothing, risky assets did not need to clear a very high bar to look appealing. Once yields moved higher, the bar changed because investors could demand more return before accepting volatility, drawdowns, illiquidity, or business risk.
This is why a professional market line analysis never treats the risk-free rate as a decorative assumption. It should match the currency, time horizon, and purpose of the analysis. A U.S. equity valuation, a sterling-based pension portfolio, and a euro-denominated private investment should not blindly use the same starting point.
Market Risk Premium: The Reward Investors Demand
The market risk premium is the engine of the line. It captures the expected excess return from taking broad market exposure instead of staying in the risk-free asset. The hard part is that expected return is forward-looking, so it has to be estimated rather than observed directly.
That is where judgment enters the room. Historical averages can be useful, but they can also create false comfort if current valuations, interest rates, profit margins, or economic conditions look very different from the past. Current capital market assumptions from firms such as Vanguard show how expected returns are regularly updated as valuations and yields change.
For practical analysis, the key is consistency. Do not use an optimistic equity premium for one decision, a conservative premium for another, and then pretend the outputs are comparable. A market line is only as credible as the assumptions behind it.
Beta and Volatility: Two Different Views of Risk
Beta and volatility often get thrown into the same bucket, but they are not the same thing. Volatility measures how much returns move around overall. Beta measures how strongly an asset tends to move with the broader market.
This distinction is the reason the capital market line and security market line can tell different stories. A highly volatile asset may have a low beta if its movements are not strongly tied to the market. A low-volatility asset may still carry meaningful systematic exposure if it tends to fall when the market falls.
That matters because diversified investors are not usually paid for taking risk they could have diversified away. The CFA Institute curriculum separates systematic and nonsystematic risk for exactly this reason. The security market line focuses on systematic risk because, under CAPM logic, that is the risk investors should expect to be compensated for bearing.
Expected Return: The Output Everyone Cares About
Expected return is where the market line becomes practical. It turns risk assumptions into a required return, a comparison point, or a portfolio decision. That makes it useful, but also dangerous if the inputs are lazy.
For the security market line, expected return rises as beta rises. A stock with higher beta should require a higher expected return because it carries more market-sensitive risk. If the expected return is not high enough, the investor is taking more systematic risk without being paid properly.
For the capital market line, expected return rises as the investor accepts more total portfolio risk through exposure to the market portfolio or leverage. This is useful when thinking about asset allocation because it shows the trade-off between safer assets, diversified risky assets, and borrowing to increase exposure. But again, the model does not remove judgment. It simply forces the judgment into the open.
Reading Risk Premiums, Mispricing, and Portfolio Trade-Offs
Once the components are clear, the market line becomes a decision tool instead of a classroom diagram. You are no longer just looking at a formula. You are asking whether the expected return on an asset or portfolio is high enough for the risk being carried.
This is where professionals separate a reasonable opportunity from a weak one. An investment can look exciting in absolute-return terms and still disappoint once it is compared with the proper risk benchmark. The market line forces that comparison into the open, which is why it remains useful even when the model itself is imperfect.
The real value is not pretending the line predicts the future perfectly. The value is discipline. It gives you a structured way to compare alternatives, challenge assumptions, and avoid making decisions based only on narrative, recent performance, or headline returns.
How to Read a Security Against the Market Line
When a security is plotted on the security market line, its position tells you whether its expected return appears fair for its beta. A point above the line suggests the security offers more expected return than the model requires for its systematic risk. A point below the line suggests the expected return is too low for the risk being taken.
That does not automatically mean you should buy everything above the line and avoid everything below it. Expected returns are estimates, beta is backward-looking unless adjusted, and market conditions can change quickly. The better interpretation is that the security deserves more investigation because the model is flagging a possible gap between price, risk, and required return.
This is especially useful when comparing securities that look similar on the surface. Two companies may both offer attractive growth, but if one requires far more market-sensitive risk to reach the same expected return, the market line exposes that trade-off. It turns a vague preference into a more precise risk-adjusted conversation.
How to Read a Portfolio Against the Market Line
A portfolio is usually judged against the capital market line when the focus is total risk. If the portfolio sits below the line, it is not offering enough expected return for its volatility under the model’s assumptions. That usually points to poor diversification, expensive exposures, weak asset allocation, or simply too much uncompensated risk.
A portfolio on the line is theoretically efficient because it gives the best expected return for a given level of total risk. A portfolio above the line should not exist in the clean version of the model because the line itself represents the highest available trade-off. In the real world, a point that appears above the line usually means your assumptions need to be checked before you celebrate.
This is the practical takeaway: the market line is not only about picking securities. It also helps you judge whether the whole portfolio is doing its job. If a portfolio takes a lot of volatility but produces weak expected compensation, the issue is not bravery; it is bad structure.
A Practical Process for Using the Market Line
A clean process matters because a market line can become misleading fast when inputs are chosen casually. The goal is not to build a complicated model for the sake of looking sophisticated. The goal is to make each assumption visible enough that it can be challenged.
A professional workflow usually starts with the objective. Are you evaluating a single stock, comparing funds, setting a discount rate, or reviewing a full portfolio? The answer determines whether the security market line, capital market line, or both should be part of the analysis.
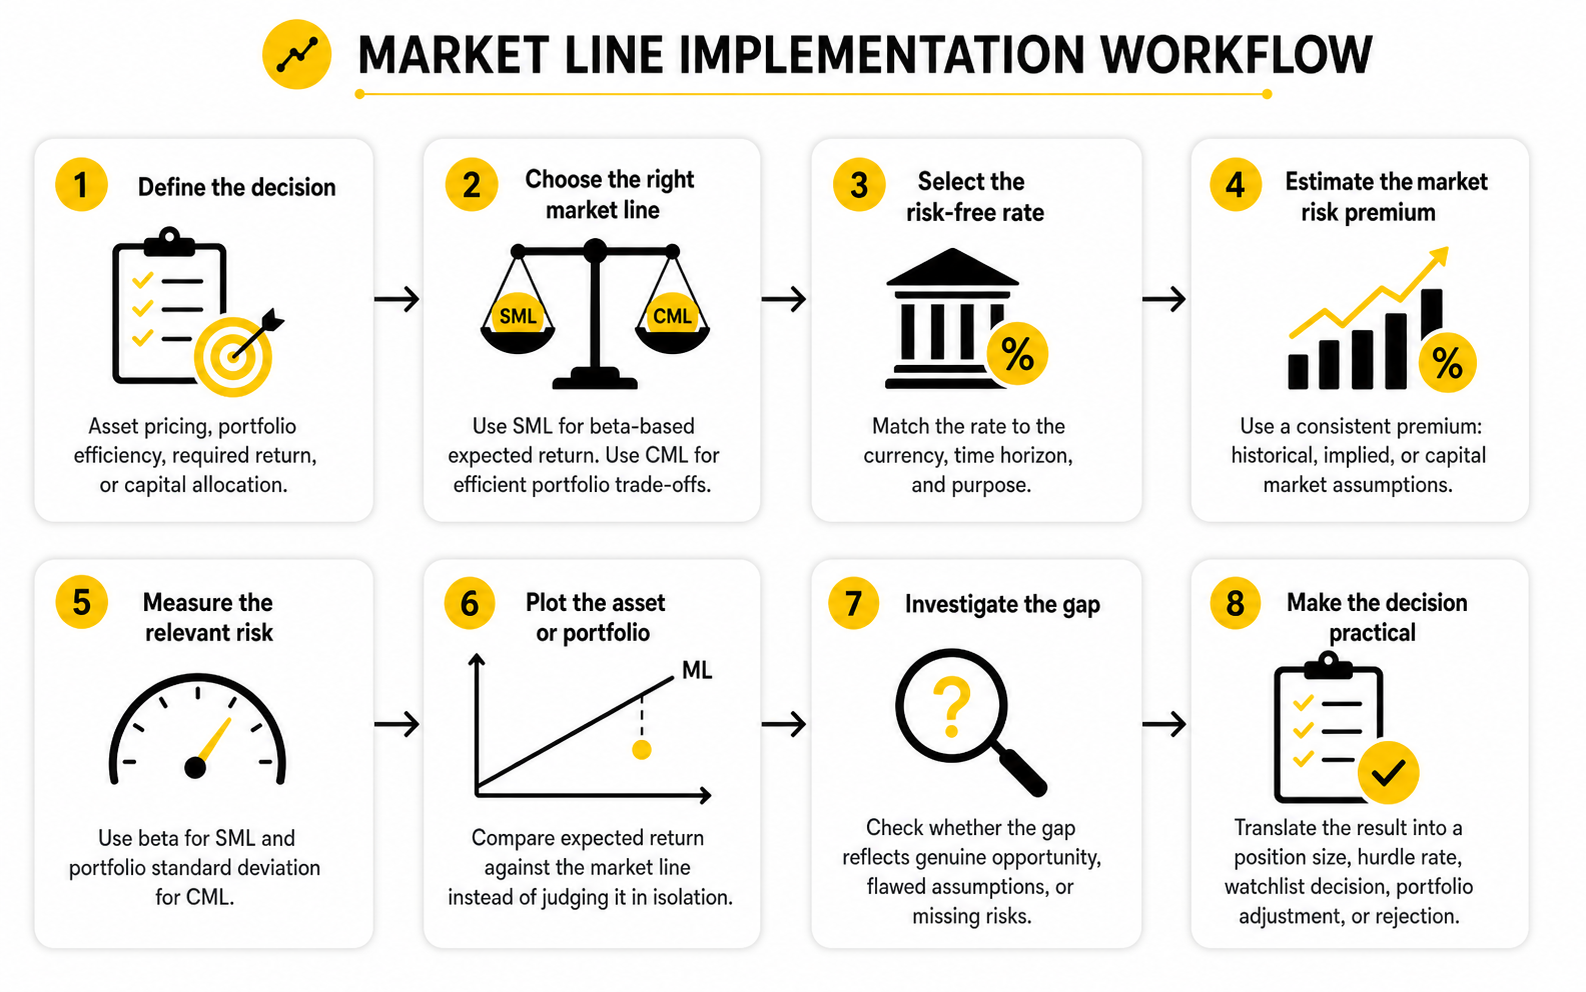
A simple implementation process looks like this:
This process works because it slows down the analysis. You are not just asking whether something “looks good.” You are asking what return is required, what risk is being measured, and whether the opportunity clears the bar after those assumptions are made explicit.
Estimating the Inputs Without Fooling Yourself
The hardest part of using a market line is not drawing the line. It is choosing inputs that are defensible. A beautiful chart built on weak assumptions is still weak analysis.
The risk-free rate should come from a reliable source and should fit the investment horizon. A short-term Treasury bill may make sense for a near-term cash comparison, while a longer-maturity government yield may fit a long-term valuation or strategic allocation exercise better. The U.S. Treasury yield curve is often used in U.S. dollar analysis because it gives a transparent reference point across maturities.
The market risk premium needs even more care. Historical return data, implied equity risk premiums, and institutional capital market assumptions can all be useful, but they answer slightly different questions. Aswath Damodaran’s current data on equity risk premiums is widely used because it separates historical reference data from forward-looking implied estimates.
Beta also needs judgment. A raw beta from a data provider may reflect a specific lookback period, index choice, frequency, and market regime. For company valuation, analysts often review peer betas, adjust leverage, and consider whether the business has changed enough to make old return patterns less relevant.
Turning the Output Into a Real Decision
The output of a market line analysis should not be a decorative chart in a deck. It should influence the decision. If it does not change how you think about required return, asset selection, allocation, or risk control, the analysis is probably too shallow.
For a stock, the result may become part of the required return used in valuation. If the estimated expected return is below what the security market line requires, the investment needs a stronger thesis or a better entry price. If it appears comfortably above the line, the next step is not blind confidence; it is stress-testing the assumptions that created the gap.
For a portfolio, the result may lead to rebalancing, diversification changes, or a review of expensive active exposures. A portfolio that produces too little expected return for its volatility may need fewer overlapping positions, better factor balance, or lower-cost implementation. That is where the market line becomes useful in the real world: it pushes the conversation from opinion to trade-off.
Statistics and Data That Make the Market Line Useful
The numbers behind a market line only matter when they help you make a better decision. A beta, Sharpe ratio, volatility figure, alpha estimate, or benchmark return is not automatically useful just because it appears in a report. It becomes useful when it tells you whether the return being pursued is worth the risk being accepted.
That is the mindset to keep. Do not collect statistics like trophies. Use them to answer a practical question: is this asset, fund, or portfolio being rewarded properly after adjusting for the right kind of risk?
For individual securities, the most important data usually connects beta, expected return, and required return. For portfolios, the most important data usually connects volatility, diversification, drawdowns, benchmark performance, and risk-adjusted return. The market line is the structure that helps those numbers speak the same language.
The Core Analytics to Track
A serious market line review should start with a small set of high-signal metrics. Too many dashboards bury the decision. Too few metrics hide the risk.
The first metric is beta, because it tells you how sensitive an asset is to broad market movement. A beta above 1 usually suggests higher market sensitivity, while a beta below 1 usually suggests lower market sensitivity. That makes beta central to the security market line, but it should never be read without checking the lookback period, benchmark, and business context.
The second metric is standard deviation, because it captures the total volatility of returns. This matters more for capital market line analysis because the capital market line evaluates portfolio-level risk and return. A portfolio with high standard deviation must earn enough expected return to justify that full volatility burden.
The third metric is the Sharpe ratio, which measures excess return per unit of total risk. This connects directly to the capital market line because the slope of the capital market line is tied to the Sharpe ratio of the market portfolio. Research on the Sharpe ratio and efficient portfolios reinforces why this metric is useful, but also why estimation error can create false confidence.
The fourth metric is alpha, but it needs careful handling. Alpha can suggest return above what a model predicts, yet it can also be the result of benchmark mismatch, hidden factor exposure, leverage, illiquidity, or a short measurement window. In other words, alpha is a clue, not a verdict.
How Benchmarks Keep the Analysis Honest
A market line without a good benchmark is just a drawing. The benchmark defines what “market” means in the analysis, so choosing it casually can ruin the output. A U.S. large-cap stock, an emerging markets fund, and a multi-asset retirement portfolio should not all be judged against the same reference point.
This matters because the market line compares risk and expected return relative to a market proxy. If the proxy is wrong, the beta is wrong, the required return is wrong, and the conclusion can be wrong. That is why benchmark selection should match the asset’s investable universe, currency, region, sector exposure, and investor objective.
Benchmarks also create discipline around performance claims. The SPIVA U.S. Year-End 2024 scorecard reported that 65% of active large-cap U.S. equity funds underperformed the S&P 500 in 2024, which is a useful reminder that “professional management” does not automatically mean better benchmark-relative results. The action point is simple: before paying for active risk, check whether the manager has earned it after fees, risk, and benchmark fit.
What the Data Really Means
Good market line analysis does not stop at “above the line” or “below the line.” It asks why the position appears there. A security above the security market line may be genuinely mispriced, but it may also have an expected return estimate that is too optimistic.
The same logic applies to portfolios. A portfolio that looks close to the capital market line may be efficient under current assumptions, but that does not mean it is suitable for every investor. Liquidity needs, tax constraints, drawdown tolerance, time horizon, and behavioral risk still matter.
This is where many investors get lazy. They see one attractive metric and rush to a conclusion. A professional reads the cluster of signals together: beta, volatility, Sharpe ratio, alpha, drawdown, correlation, fees, turnover, and benchmark quality.
Performance Signals That Deserve Attention
The strongest signal is not usually one great year of performance. It is consistency across market environments. A strategy that only works in one narrow regime may look good on a chart but fail when rates, inflation, liquidity, or market leadership changes.
Drawdown behavior deserves special attention because it shows how the portfolio behaves under pressure. A portfolio can have a respectable long-term average return and still be unusable for an investor who cannot survive the path required to get there. The market line gives the return-risk relationship, but drawdown analysis shows whether the journey is tolerable.
Fees are another signal because they raise the required hurdle. A high-cost fund has to overcome its fee drag before delivering attractive risk-adjusted performance. When the expected excess return is already modest, fees can be the difference between a strategy that clears the market line and one that quietly falls short.
Turning Analytics Into Action
The best use of market line analytics is decision triage. You are not trying to predict every future return perfectly. You are trying to identify which opportunities deserve more capital, which need deeper research, and which should be rejected quickly.
When an asset appears above the security market line, the next action is to test the assumptions behind expected return. Review the earnings outlook, valuation, balance sheet risk, competitive position, and sensitivity to macro factors. If the expected return still looks strong after stress-testing, the asset may deserve a place on the shortlist.
When a portfolio appears below the capital market line, the next action is to diagnose the drag. The issue may be poor diversification, overlapping holdings, high costs, weak manager selection, or too much exposure to risks that are not being rewarded. The fix may be as simple as rebalancing, reducing fees, changing benchmarks, or cutting positions that add volatility without improving expected return.
Building a Measurement Routine
A market line review should not be a one-time exercise. Inputs change, markets move, and yesterday’s efficient portfolio can become today’s expensive compromise. The point is to build a routine that catches those changes before they become expensive.
A practical review cycle can be simple:
This routine keeps the market line tied to reality. It also prevents the classic mistake of using stale assumptions to defend a position that no longer earns its place. Data should not make the decision for you, but it should make weak decisions much harder to hide.
Professional Implementation in Portfolio and Business Analysis
Advanced market line work starts when you stop treating the model as a final answer. The line is a benchmark for required return, not a substitute for judgment. It helps you organize risk, but it cannot see everything that matters.
That distinction is crucial in professional settings. Portfolio managers, analysts, CFOs, and founders can all use a market line, but they should use it differently. The same logic that helps an investor compare securities can also help a business evaluate hurdle rates, capital allocation, and whether a growth project is worth the risk.
The practical question is always the same: what return should this decision require after considering the risk involved? Once that question is clear, the market line becomes a useful starting point. Not the whole answer. The starting point.
Strategic Trade-Offs the Market Line Can Miss
The classic market line framework is elegant because it simplifies risk into a clean relationship. That elegance is also the trap. Real markets include taxes, transaction costs, leverage limits, liquidity shocks, changing correlations, and investor behavior.
Liquidity is one of the biggest blind spots. A security can look attractive against the security market line and still be a bad fit if it becomes hard to sell under stress. Research on asset pricing with liquidity risk shows why required returns can depend not only on market beta, but also on how liquidity behaves when markets get difficult.
Leverage is another blind spot. The capital market line assumes investors can combine the risk-free asset and market portfolio in a clean way, but real investors face borrowing costs, margin rules, collateral demands, and emotional pressure during drawdowns. Fischer Black’s work on capital market equilibrium with restricted borrowing matters because it challenged the neat assumption that everyone can borrow freely at the risk-free rate.
When Beta Is Too Narrow
Beta is useful, but it is not a full personality profile for an investment. It tells you how the asset has moved relative to a benchmark. It does not tell you whether the company has customer concentration, fragile financing, governance risk, obsolete technology, or exposure to a regulatory change.
This is where analysts get into trouble. They calculate a required return using the security market line, plug it into a valuation, and act like the answer is precise. But if the beta is based on the wrong peer group, the wrong index, or a period that no longer reflects the business, the output can look scientific while being deeply fragile.
Fama and French’s review of CAPM theory and evidence is still relevant because it highlights a core issue: market beta alone has not fully explained average returns in the way the simplest model predicts. That does not make beta useless. It means beta should be one input in a broader risk conversation.
Factor Exposure and Hidden Risk
Many portfolios that look diversified are actually just repeating the same bet in different wrappers. They may hold dozens of positions, but the real exposure may be concentrated in size, value, momentum, quality, duration, credit, sector, geography, or currency. A basic market line can miss those hidden clusters if the analysis stops at broad market beta.
This matters most when a portfolio performs well for the wrong reason. A manager may appear to generate alpha when the real driver is exposure to a rewarded factor, leverage, illiquidity, or a narrow market regime. Once that exposure is recognized, the investor can decide whether the fee and risk are justified.
That is why expert-level implementation often pairs the market line with factor analysis. The market line asks whether return is fair for measured market risk. Factor analysis asks whether the return came from skill, structure, or simply a known exposure wearing a nice suit.
Scaling the Framework Across a Real Portfolio
A single-security market line analysis is manageable. A real portfolio is messier because every decision affects the whole risk system. Adding one attractive asset can still make the portfolio worse if it increases concentration, correlation, liquidity risk, or drawdown risk at the wrong time.
The key is to evaluate marginal contribution, not just standalone attractiveness. An investment that looks average on its own may improve the portfolio if it diversifies existing exposures. Another investment may look excellent by itself but add very little if the portfolio already owns the same risk through other holdings.
This is especially important for institutions and larger portfolios. The bigger the capital base, the more implementation issues matter: trading costs, market impact, capacity, rebalancing discipline, tax lots, custody rules, and governance. A market line can show the target trade-off, but execution determines whether the portfolio actually captures it.
Using the Market Line for Business Decisions
The market line is not only useful for public-market investing. It can also support business decisions when leaders need to estimate a required return on risky projects. The same logic behind the security market line often appears in cost of equity estimates, weighted average cost of capital, and capital budgeting.
A company evaluating a new product line, acquisition, or expansion should not judge the project only by its headline growth potential. It should ask whether the expected return clears a risk-adjusted hurdle. If the project is more cyclical, more leveraged, more uncertain, or more exposed to macro conditions than the core business, it may deserve a higher required return.
This is where the thinking becomes very practical. A founder or operator may not draw a literal market line in every planning meeting, but the discipline still applies. Risky growth is not automatically good growth. Growth only deserves capital when the expected return justifies the risk, the opportunity cost, and the execution burden.
Expert Guidance for Better Decisions
The best professionals use the market line with humility. They know the model is useful because it creates structure. They also know it becomes dangerous when people confuse structure with certainty.
Use the market line to set the baseline, then layer in the risks the model does not capture well. Ask whether liquidity could disappear, whether the beta is still representative, whether leverage could force selling, whether fees are eating the premium, and whether the benchmark actually matches the decision. Those questions matter more than squeezing another decimal point out of the model.
A strong implementation checklist looks like this:
This is the point where the market line becomes genuinely useful. It does not promise certainty. It gives you a professional way to avoid sloppy risk-taking, weak hurdle rates, and portfolio decisions that sound confident but do not earn their keep.
Limits, Best Practices, and Market Line FAQ
A market line is most useful when it is treated as a thinking system. It gives you a clean way to connect risk, expected return, and decision quality. But it becomes dangerous when people use it as a shortcut for certainty.
The smartest approach is to combine the market line with real-world judgment. That means checking whether the benchmark fits, whether the risk-free rate is current, whether beta still reflects the asset, whether the portfolio has hidden factor exposure, and whether fees or taxes quietly change the result. The SEC’s investor guidance on fund and ETF fees makes this point practical because even small recurring costs reduce what investors actually keep.
The final system should be simple enough to use and serious enough to trust. Set the baseline with the market line. Stress-test the assumptions. Then make the decision based on risk-adjusted opportunity, not just optimism.
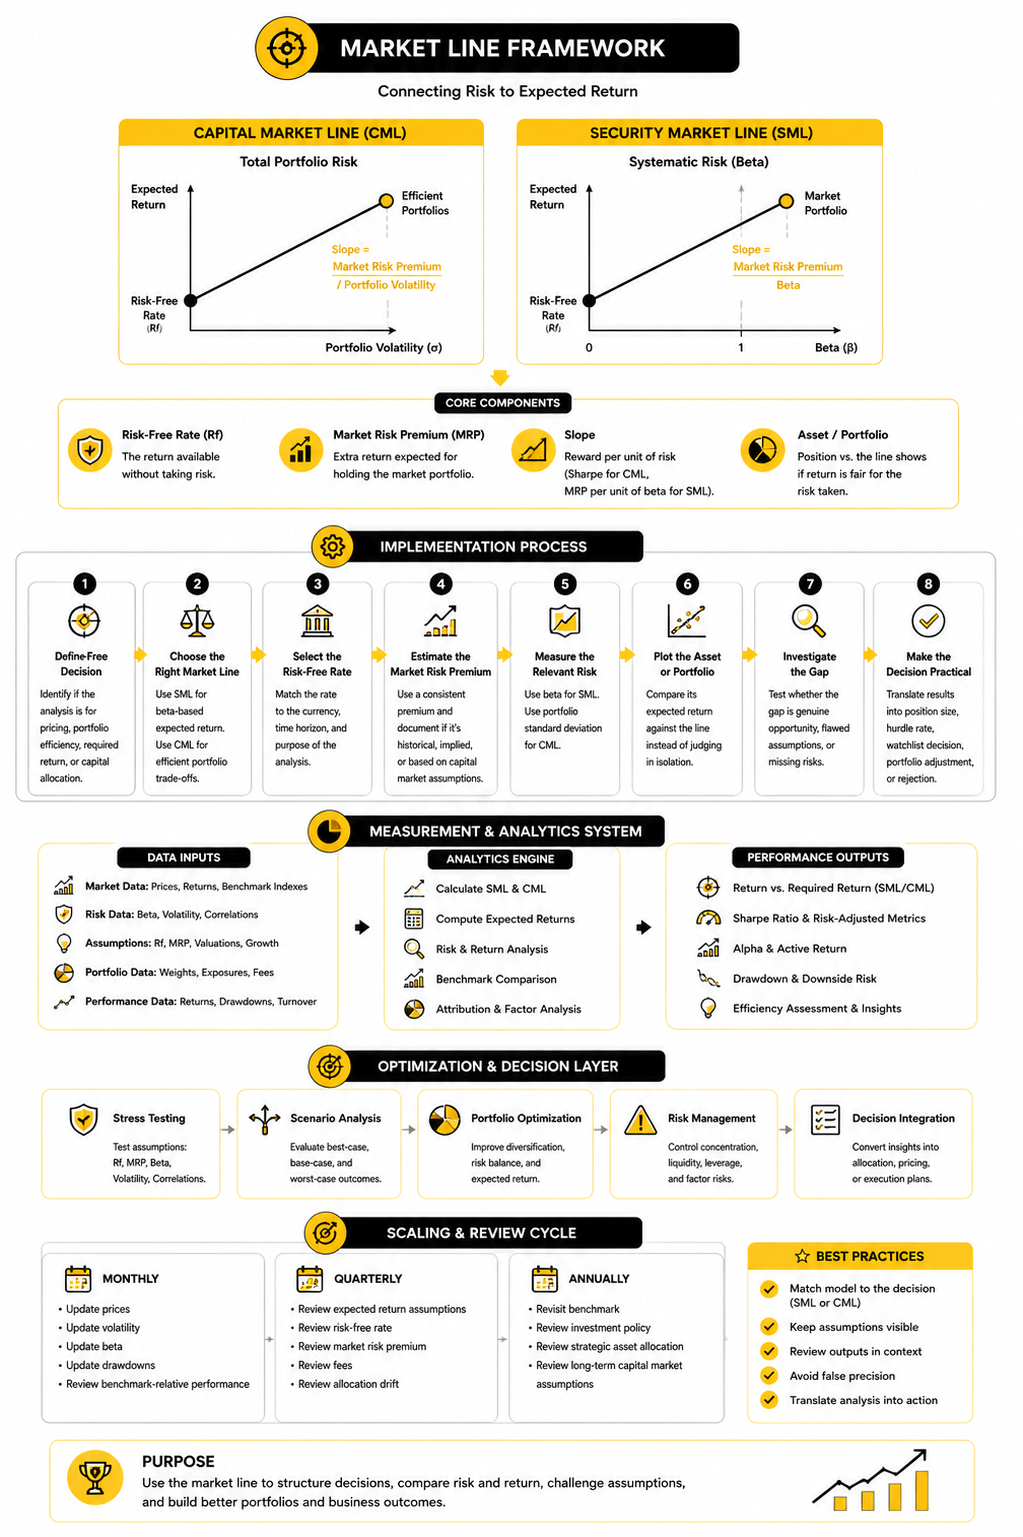
Best Practices for Using a Market Line
The first best practice is to match the model to the decision. Use the security market line when you need a beta-based required return. Use the capital market line when you are evaluating efficient portfolios and total volatility.
The second best practice is to keep assumptions visible. A market line hides too much when the risk-free rate, market premium, beta, volatility, and benchmark are buried inside a spreadsheet. Write them down so they can be challenged before money is committed.
The third best practice is to review the output in context. A position that looks attractive on a market line may still fail because of liquidity risk, poor timing, taxes, leverage, concentration, or weak execution. Research from the Bank for International Settlements on correlation breakdowns during market stress shows why portfolio risk estimates can be too optimistic when diversification assumptions are based on calm periods.
The fourth best practice is to avoid false precision. CAPM and related market line models are useful, but empirical research has long shown that beta alone does not explain all expected-return differences. Fama and French’s review of CAPM theory and evidence is a good reminder that a clean model can still miss important return drivers.
What is a market line in finance?
A market line is a visual framework that connects expected return with risk. In most finance discussions, it refers to either the capital market line or the security market line. Both help investors judge whether the expected return is reasonable for the risk being taken.
What is the difference between the capital market line and the security market line?
The capital market line evaluates efficient portfolios using total risk, usually measured by standard deviation. The security market line evaluates individual securities or portfolios using beta, which measures systematic market risk. The difference matters because total volatility and market sensitivity are not the same thing.
Why does the market line start at the risk-free rate?
The market line starts at the risk-free rate because that is the theoretical return available without taking risky-asset exposure. From there, investors require additional return as they accept more risk. If the risk-free rate changes, the whole required-return conversation changes with it.
What does it mean if an asset is above the security market line?
An asset above the security market line appears to offer more expected return than required for its beta. That can suggest undervaluation or an attractive risk-adjusted opportunity. It can also mean the expected-return estimate is too optimistic, so the next step is always deeper due diligence.
What does it mean if an asset is below the security market line?
An asset below the security market line appears to offer too little expected return for its systematic risk. That does not automatically mean it should be sold, but it does mean the investment thesis needs stronger support. The investor should check valuation, risk assumptions, benchmark fit, and alternative opportunities.
Can a portfolio be above the capital market line?
In the clean theoretical model, the capital market line represents the best available trade-off between expected return and total risk, so a portfolio should not sit above it. In practice, a portfolio may appear above the line because assumptions are wrong, data is stale, or the analysis misses hidden risks. Treat that result as a reason to investigate, not as proof of genius.
Is beta enough to measure investment risk?
Beta is useful, but it is not enough on its own. It measures sensitivity to a market benchmark, not liquidity risk, business risk, leverage risk, governance risk, or the possibility that correlations change under pressure. A serious analysis uses beta as one input, not the full risk story.
How often should market line assumptions be updated?
Market line assumptions should be updated whenever rates, valuations, volatility, or portfolio exposures change meaningfully. A monthly update can work for basic monitoring, while quarterly reviews are better for expected returns, market premiums, and allocation decisions. Annual reviews should revisit the benchmark and the long-term investment policy.
How do fees affect market line analysis?
Fees lower the return investors actually keep. That matters because a fund or strategy may look attractive before fees but fall below the required return after expenses. The more modest the expected excess return, the more important fees become.
Does the market line work for private investments?
The market line can support private investment analysis, but it needs extra caution. Private assets often have stale pricing, limited liquidity, uncertain beta, and appraisal-based volatility that may understate true risk. The framework is useful for setting hurdle rates, but it should be combined with scenario analysis, liquidity planning, and conservative assumptions.
Can business owners use market line thinking?
Yes, especially when deciding whether a project deserves capital. A business owner may not draw a formal security market line, but the same idea applies: higher-risk projects should clear a higher return hurdle. Growth that does not compensate for risk, complexity, and opportunity cost is not good growth.
What is the biggest mistake people make with a market line?
The biggest mistake is treating the market line like a machine that produces truth. It is a model, and models depend on assumptions. Use it to structure the decision, then challenge the inputs before acting.
Build a stronger local presence with BAAM AI
Turn your website, Google profile, social channels, and AI visibility into one growth engine
Most businesses do not need more random marketing activity. They need a consistent presence system that helps the right people find them, trust them, and take action. BAAM AI brings strategy, local SEO, website updates, Google Maps visibility, social content, AI-search readiness, media production, and reporting into one practical monthly engine.
If you want your marketing to keep working after the campaign ends, start with a free BAAM AI presence audit. See how your business shows up today and where the fastest visibility wins are at BAAM AI.