BAAM AI Blog
Conversion, Merchandising, And Ecommerce Performance
Acquisition brings shoppers into the system, but conversion decides whether retail digital marketing turns into money. This is where the work becomes less glamorous and more important. A retailer can have strong...
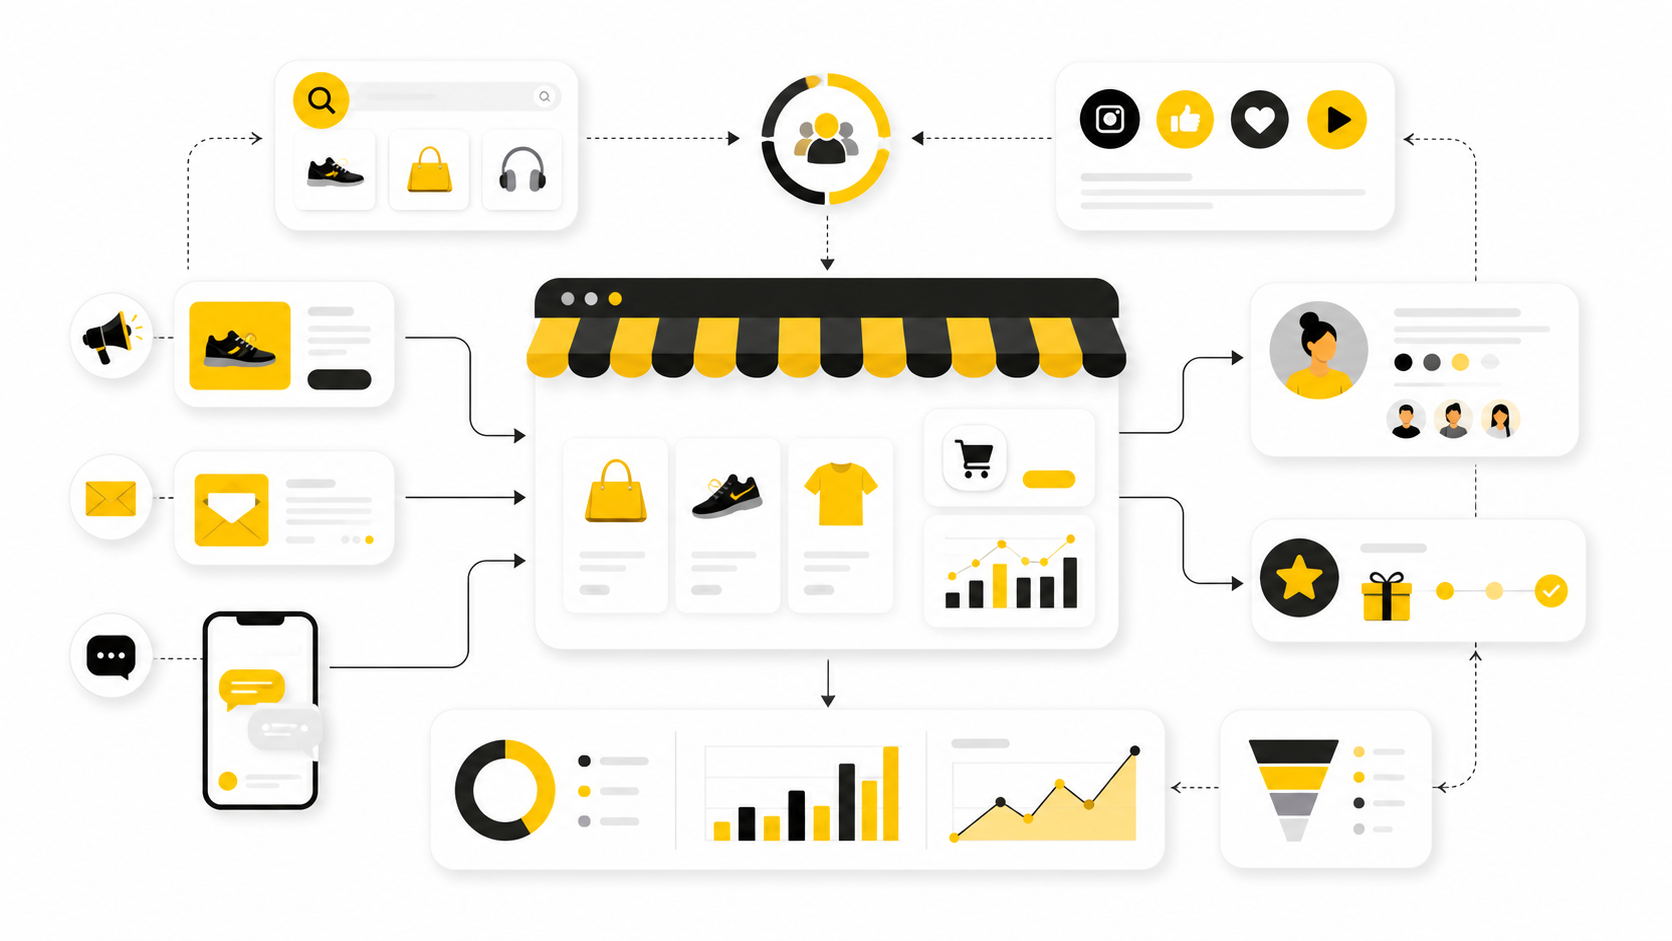
Acquisition brings shoppers into the system, but conversion decides whether retail digital marketing turns into money. This is where the work becomes less glamorous and more important. A retailer can have strong creative, smart targeting, and healthy traffic, but weak merchandising, unclear product pages, slow checkout, poor delivery options, or confusing offers will quietly drain performance.
Ecommerce performance is not one metric. It is the combined result of product demand, traffic quality, page experience, pricing, merchandising, trust, delivery, payment, and follow-up. When one of those parts breaks, the numbers usually show the symptom before the team understands the cause.
That is why this part focuses on measurement and interpretation. Not random stats. Not dashboard decoration. The goal is to understand what the numbers are trying to tell you and what action they should drive.
Statistics And Data That Actually Matter
Benchmarks are useful only when they create better decisions. A retailer should not panic because one average says the store is below benchmark, and it should not relax because one channel looks above average. Benchmarks are starting points, not strategy.
A good example is cart abandonment. Baymard’s long-running checkout research shows an average documented ecommerce cart abandonment rate of roughly 70% across multiple studies, which sounds brutal until you realize abandonment is not always a checkout problem. Some shoppers are comparing prices, checking shipping, saving items, waiting for payday, looking for coupon codes, or simply browsing.
The action is not “send more abandoned cart emails” by default. The action is to diagnose why people abandon. If the drop-off happens before shipping costs appear, the issue may be product confidence or price. If the drop-off spikes after shipping, the issue may be delivery value. If the drop-off happens at account creation, payment, or form fields, the issue is probably checkout friction.
Build A Measurement System Before Judging Performance
Retail measurement needs structure because no single platform sees the whole truth. Ad platforms over-credit themselves, analytics tools miss parts of the journey, email platforms highlight their own revenue, and ecommerce dashboards often ignore margin. A professional measurement system connects these views without pretending attribution is perfect.
The cleanest setup starts with four layers: business metrics, customer metrics, channel metrics, and page metrics. Business metrics tell you whether the retailer is making money. Customer metrics show whether the brand is acquiring and keeping valuable customers. Channel metrics explain where demand is coming from. Page metrics reveal where shoppers move forward or drop off.
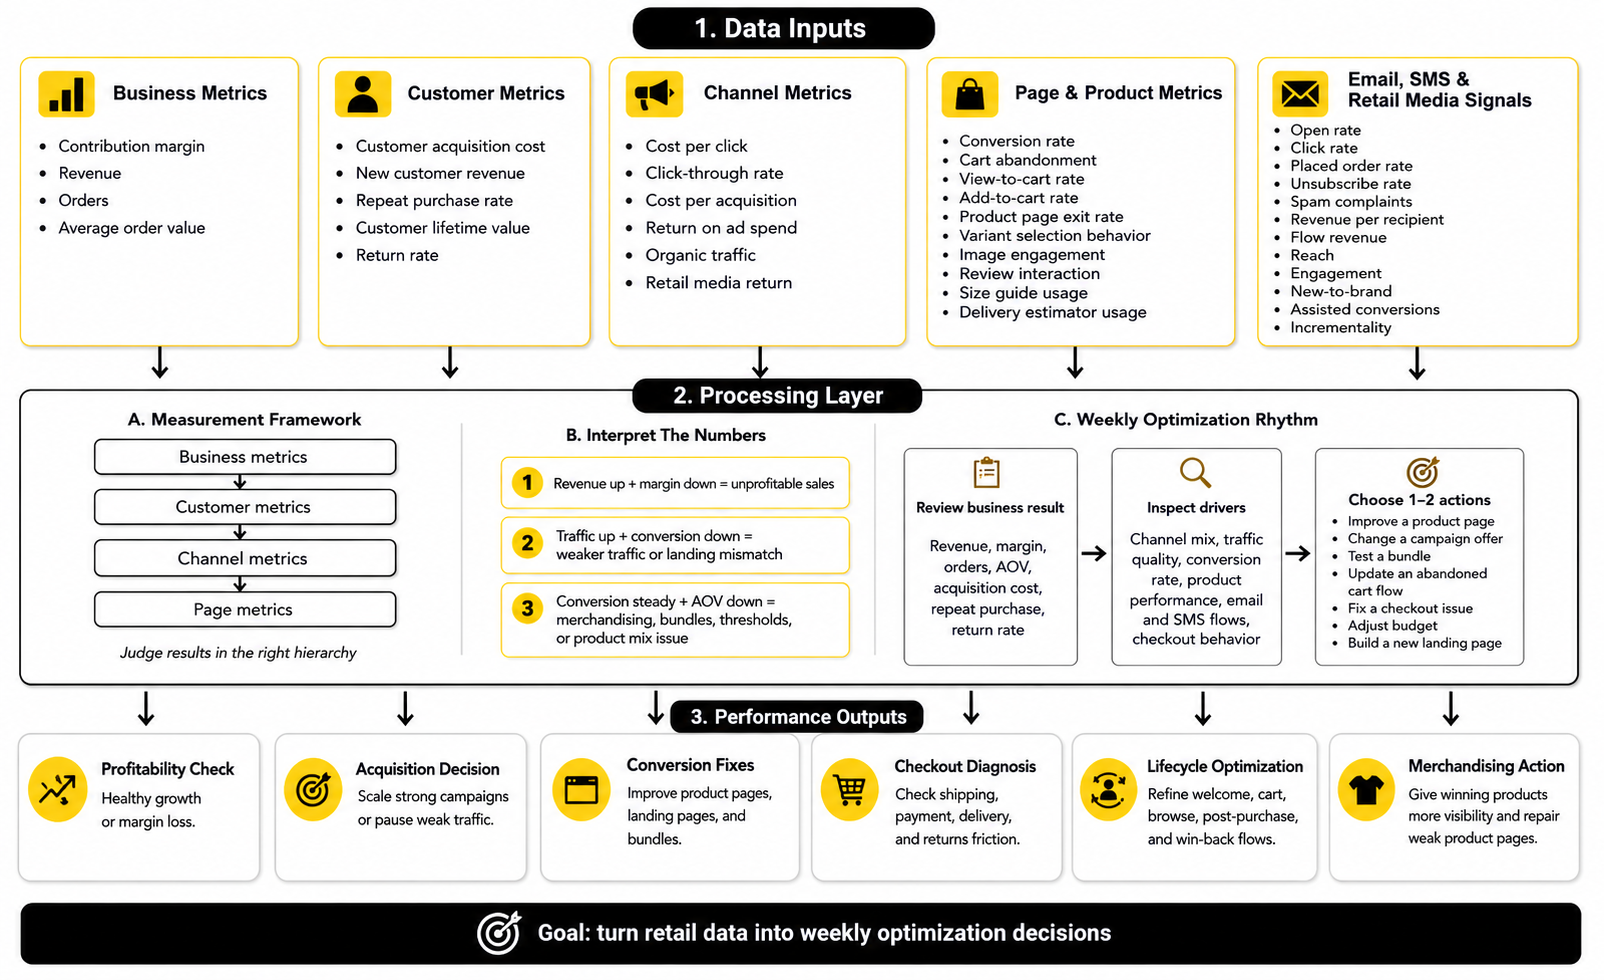
The point is to make decisions in the right order. If revenue is growing but margin is falling, the business may be buying unprofitable sales. If traffic is rising but conversion rate is falling, acquisition may be bringing weaker shoppers or the landing experience may not match the promise. If conversion rate is stable but average order value is falling, merchandising, bundles, thresholds, or product mix may need attention.
Track The Metrics In The Right Hierarchy
The most useful retail digital marketing dashboard starts with contribution, not clicks. Revenue matters, but contribution margin is more honest because it accounts for product cost, discounts, shipping impact, payment fees, fulfillment, and returns. Without that lens, a campaign can look strong while quietly damaging profit.
After contribution, track customer acquisition cost, new customer revenue, repeat purchase rate, average order value, conversion rate, cart abandonment, return rate, and customer lifetime value. These numbers explain whether growth is healthy or fragile. A retailer with rising revenue but falling repeat purchase rate may be creating short-term demand without building a durable customer base.
Channel metrics come next. Cost per click, click-through rate, cost per acquisition, return on ad spend, email revenue per recipient, SMS revenue per recipient, organic traffic, and retail media return are useful, but they are not the final truth. They are diagnostic signals that help explain the business result.
Read Conversion Rate With Context
Conversion rate is one of the most watched retail metrics, and also one of the easiest to misread. A higher conversion rate is not automatically better if it comes from heavy discounting, lower-margin products, or reduced traffic from new shoppers. A lower conversion rate is not automatically bad if the retailer is expanding into colder audiences that create future demand.
Industry benchmarks can help with perspective, but they should not become the target. Smart Insights notes that ecommerce conversion benchmarks vary meaningfully by sector, device, and data source, with 2025 comparisons often relying on platform datasets such as Dynamic Yield and IRP Commerce. That variation matters because a beauty replenishment store, a luxury furniture brand, and a grocery retailer should not expect the same conversion pattern.
The better question is what changed. If conversion rate drops after a new campaign launches, check traffic quality and message match. If conversion drops after a site change, inspect page speed, mobile layout, checkout, product information, and tracking. If conversion drops during a promotion, the offer may be attracting bargain hunters who browse more but buy less.
Measure Product Page Performance Like A Sales Conversation
A product page is not just a catalog entry. It is a sales conversation happening without a salesperson. The page has to explain the product, answer objections, show proof, clarify delivery and returns, and make the next step obvious.
Useful product page metrics include view-to-cart rate, add-to-cart rate, variant selection behavior, image engagement, review interaction, size guide usage, delivery estimator usage, and product page exit rate. These signals show whether shoppers understand the product and feel confident enough to move forward. If many people view the page but few add to cart, the issue is usually offer, price, proof, product clarity, or audience fit.
Merchandising also affects conversion before the product page. Collection sorting, filters, search results, product naming, badges, bundles, and availability messages all shape what shoppers notice. Strong retail digital marketing does not treat merchandising as a back-office task because merchandising is part of the conversion path.
Connect Analytics To Merchandising Decisions
Analytics becomes useful when it changes what the retailer does. If a product gets high traffic but low conversion, it may need better images, clearer sizing, stronger reviews, a sharper offer, or a different landing page. If a product gets low traffic but strong conversion, it may deserve more visibility in ads, email, collections, or store merchandising.
If a category gets high add-to-cart activity but weak checkout completion, the retailer should inspect shipping costs, payment methods, delivery promises, and returns anxiety. If bundles lift average order value without hurting conversion, they may deserve more prominent placement. If discounts lift conversion but lower profit per order, the team needs to test value-based offers instead of automatically increasing the discount.
This is where a tool like Replo can be useful for testing landing page angles around specific products or categories. For funnel-based campaigns, ClickFunnels can help create focused paths when a retailer wants more control than a standard product page gives. The tool is not the strategy, but faster testing can help the team learn what actually moves shoppers forward.
Use Email And SMS Metrics As Behavior Signals
Email and SMS should not be judged only by campaign revenue. Open rate, click rate, placed order rate, unsubscribe rate, spam complaints, revenue per recipient, and flow revenue all reveal customer behavior. The real question is whether messages are becoming more relevant or just more frequent.
Klaviyo’s 2025 benchmark materials are based on billions of emails and text messages across verticals, which makes them useful for directional comparison. But the action should still depend on lifecycle context. A low click rate on a broad newsletter means something different from a low recovery rate on an abandoned checkout flow.
If welcome emails get engagement but few first purchases, the offer, proof, or first-purchase path may need work. If abandoned cart flows recover poorly, the issue may be shipping, price, payment options, timing, or weak urgency. If repeat purchase flows perform well, the retailer may have an opportunity to build stronger replenishment, loyalty, or category expansion campaigns using tools like Brevo or Moosend.
Treat Retail Media Measurement Carefully
Retail media can sit close to the purchase, which makes it attractive. It can also be difficult to measure cleanly because every network may define audiences, attribution windows, incrementality, and reporting differently. That creates a real risk of comparing numbers that look similar but mean different things.
The IAB and MRC retail media measurement guidelines were created to bring more consistency to areas like reporting, attribution, invalid traffic, viewability, and in-store measurement. That matters because retail media budgets are growing, and bigger budgets need stronger accountability. Retailers should ask what sales are incremental, what audience was reached, what attribution window was used, and whether the campaign influenced total category performance or only shifted credit.
The action is to separate retail media into clear jobs. Sponsored placements can be measured closer to sales efficiency. Upper-funnel retail media should be judged with reach, engagement, new-to-brand signals, assisted conversions, and incrementality where available. Mixing those goals into one blended return number makes the channel look cleaner than it really is.
Watch For The Signals That Something Is Broken
Retail analytics should help teams catch problems early. A sudden drop in conversion rate can signal a broken checkout, tracking issue, stock problem, slow page, or traffic mismatch. A spike in add-to-cart with no matching order growth often points to shipping, payment, coupon, or trust friction.
A rising return rate can reveal product description problems, sizing issues, quality gaps, poor customer fit, or aggressive acquisition campaigns bringing the wrong buyers. A falling repeat purchase rate can show that the retailer is over-relying on promotions, acquiring low-fit customers, or failing to create a useful post-purchase journey. A rising unsubscribe rate means the brand is spending customer attention too aggressively.
These signals should trigger investigation, not panic. The best teams build weekly review habits around the few numbers that matter most. They do not wait for the month to end before asking why the funnel changed.
Turn Data Into A Weekly Optimization Rhythm
A simple weekly rhythm can improve retail digital marketing faster than a bloated monthly report. Start with the business result: revenue, margin, orders, average order value, acquisition cost, repeat purchase, and return rate. Then inspect the main drivers: channel mix, traffic quality, conversion rate, product performance, email and SMS flows, and checkout behavior.
Next, choose one or two actions for the week. That might mean improving a product page, changing a campaign offer, testing a bundle, updating an abandoned cart flow, fixing a checkout issue, adjusting budget, or building a new landing page. The point is to turn data into controlled movement.
Retailers do not need perfect attribution to make better decisions. They need consistent definitions, clean enough tracking, margin-aware reporting, and the discipline to ask what the number means before reacting to it. Once measurement is working, the next layer is retention: turning first-time buyers into customers who come back because the experience keeps earning their trust.
Build a stronger local presence with BAAM AI
Turn your website, Google profile, social channels, and AI visibility into one growth engine
Most businesses do not need more random marketing activity. They need a consistent presence system that helps the right people find them, trust them, and take action. BAAM AI brings strategy, local SEO, website updates, Google Maps visibility, social content, AI-search readiness, media production, and reporting into one practical monthly engine.
If you want your marketing to keep working after the campaign ends, start with a free BAAM AI presence audit. See how your business shows up today and where the fastest visibility wins are at BAAM AI.